*Note: We hope you find these insights from past years useful, and we know 2020 brings with it new challenges & considerations. For the most up-to-date insights, check out our latest blog on 2020 Thanksgiving Predictions & Planning.
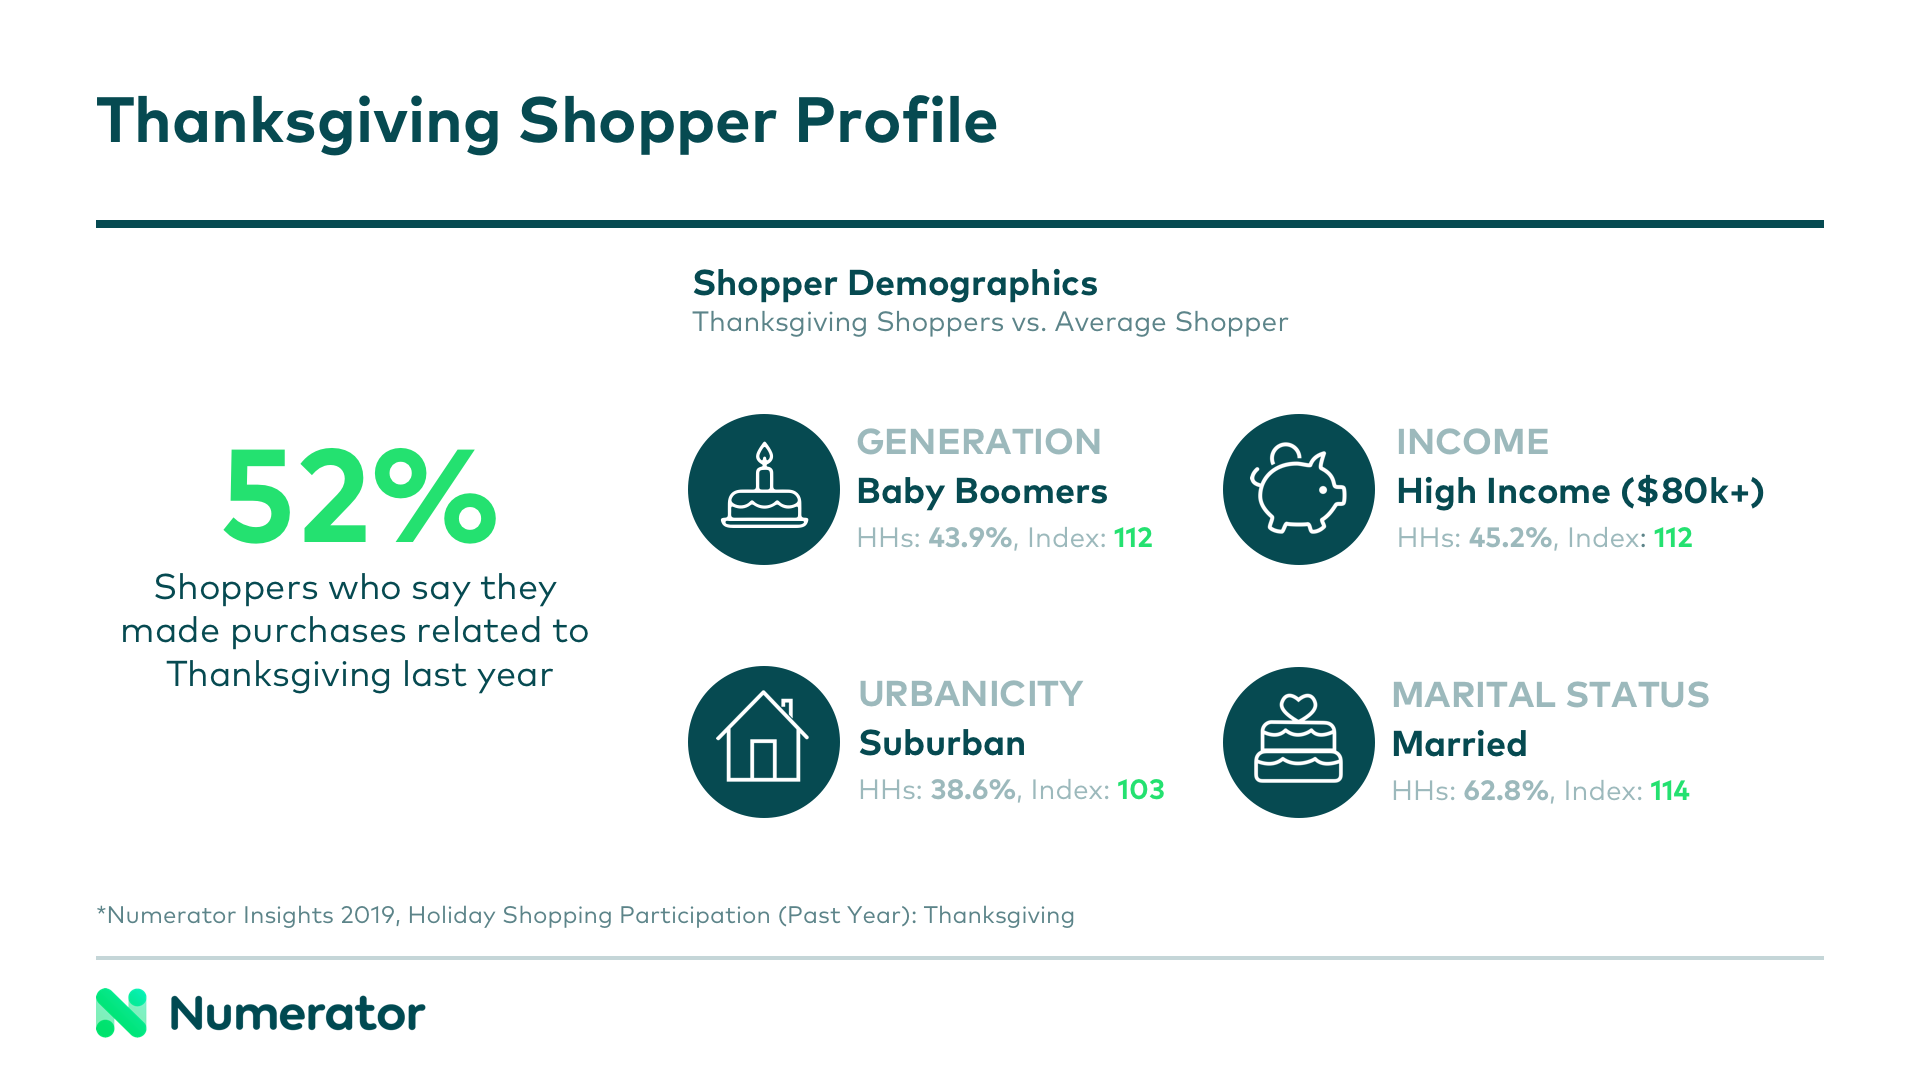
Last year, 52% of individuals indicated they participated in Thanksgiving shopping. Across generations, there was a clear trend: younger generations were less likely to participate, older generations were more. Is this an effect of lifestage, or is it a generational shift we’ll see impacting the holidays for years to come? Do generations’ behavioral and attitudinal differences inform the brands and products they buy? Though only time will answer the first question, Numerator has a wealth of data to help you understand these consumers today.
We looked at grocery buying behavior in the weeks leading up to Thanksgiving and determined which products each generation were most likely to bring to the Thanksgiving table. Beyond product affinities, we also took a look at differences in timing, brand preferences, and cooking and dining attitudes between generations to get a better idea of the whys behind their Thanksgiving buys.
Baby Boomers: Hear them Roar (Gobble?)
Boomers were 1.6x more likely to purchase a turkey than any other generation.
As is the case with most categories and occasions, the Baby Boomer generation accounted for the largest portion (39.3%) of grocery spending in the weeks leading into Thanksgiving in 2018. Their buying power is significant, and catering to this generation’s needs and preferences is still a recipe for immediate wins. Fittingly, Baby Boomers were also the poster children for “Thanksgiving Shoppers,” according to our data— high income, married Boomers living in the suburbs, if we’re getting specific.

Gen X: Late to the Party, Ready to Party
1.3x more likely to purchase cocktails & mixers
Gen X’ers made up the second largest portion (31.4%) of Thanksgiving grocery spend. They were also the most likely to make a last-minute purchase, either the day before or day of Thanksgiving. 40% of Thanksgiving shoppers participated in this last-minute purchasing, and 71% of these trips were small, containing less than 10 items. Interestingly, 57% of these last- minute buyers had also made a larger (21+ item) grocery trip within the preceding week, which indicates they may have forgotten something, or that they were purchasing fresh products for more immediate consumption.
According to Numerator Psychographics data, compared to the average Thanksgiving shopper, Gen X Thanksgiving shoppers were slightly less likely to make grocery lists or to check ads, and slightly more likely to make impulse buys. Though these differences were small, a lack of planning ahead may at least partially explain the propensity for last-minute buying among the group.
Millennials: Turkey, But Make it Vegan
1.8x more likely to purchase meat alternatives
Our next largest group of consumers is Millennials, who made up 23.7% of Thanksgiving grocery spend last year. As their affinity for alternative meats might suggest, this group is nearly twice as likely to be vegan or vegetarian than the average Thanksgiving buyer, according to our psychographics data. They are also more likely to seek natural or organic foods, and to consider themselves “very committed” to the organic movement. As one might expect, this group spent a larger portion of their grocery dollars on fruits and vegetables and less on traditional meat compared to other generations.
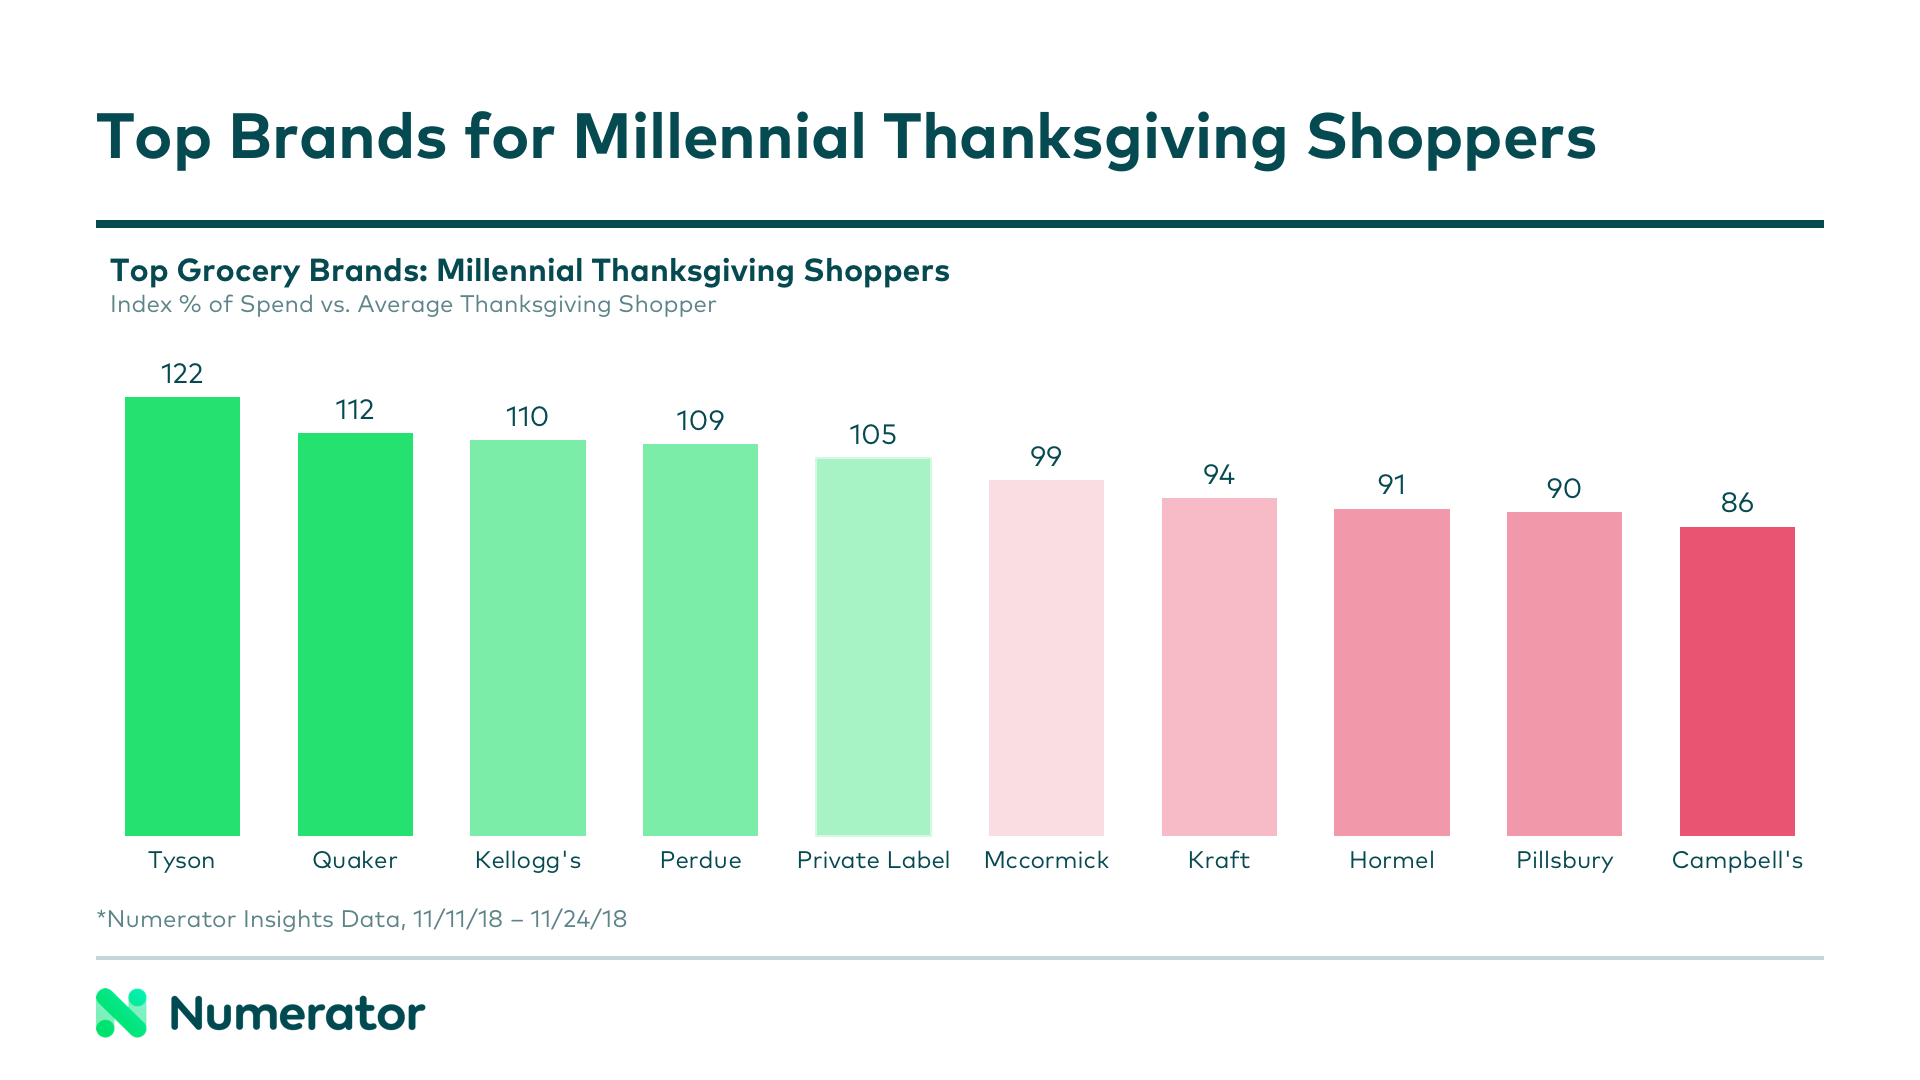
Many big brands that typically shine during the holidays didn’t seem to resonate with Millennials, perhaps because of health related offerings or shifting tastes. Millennials spent less of their grocery dollars on Campbells, Pillsbury and McCormick than the average Thanksgiving shopper, over-indexing instead on Tyson, Quaker and Private Label.

Seniors: Just a Small Slice of Pie for Them
1.3x more likely to purchase pies (+cobblers, creams and flans)
Seniors may only have accounted for 2.9% spend last Thanksgiving, but they didn’t go unnoticed. In true MVP fashion, Seniors were more likely to purchase a variety of sweet treats than other generations. Pies, dessert breads, pastries, and whipped cream toppings… it’s safe to say that this is the sweetest generation of all.
Gen Z: Were they supposed to bring something?
1.2x more likely to purchase snack mix
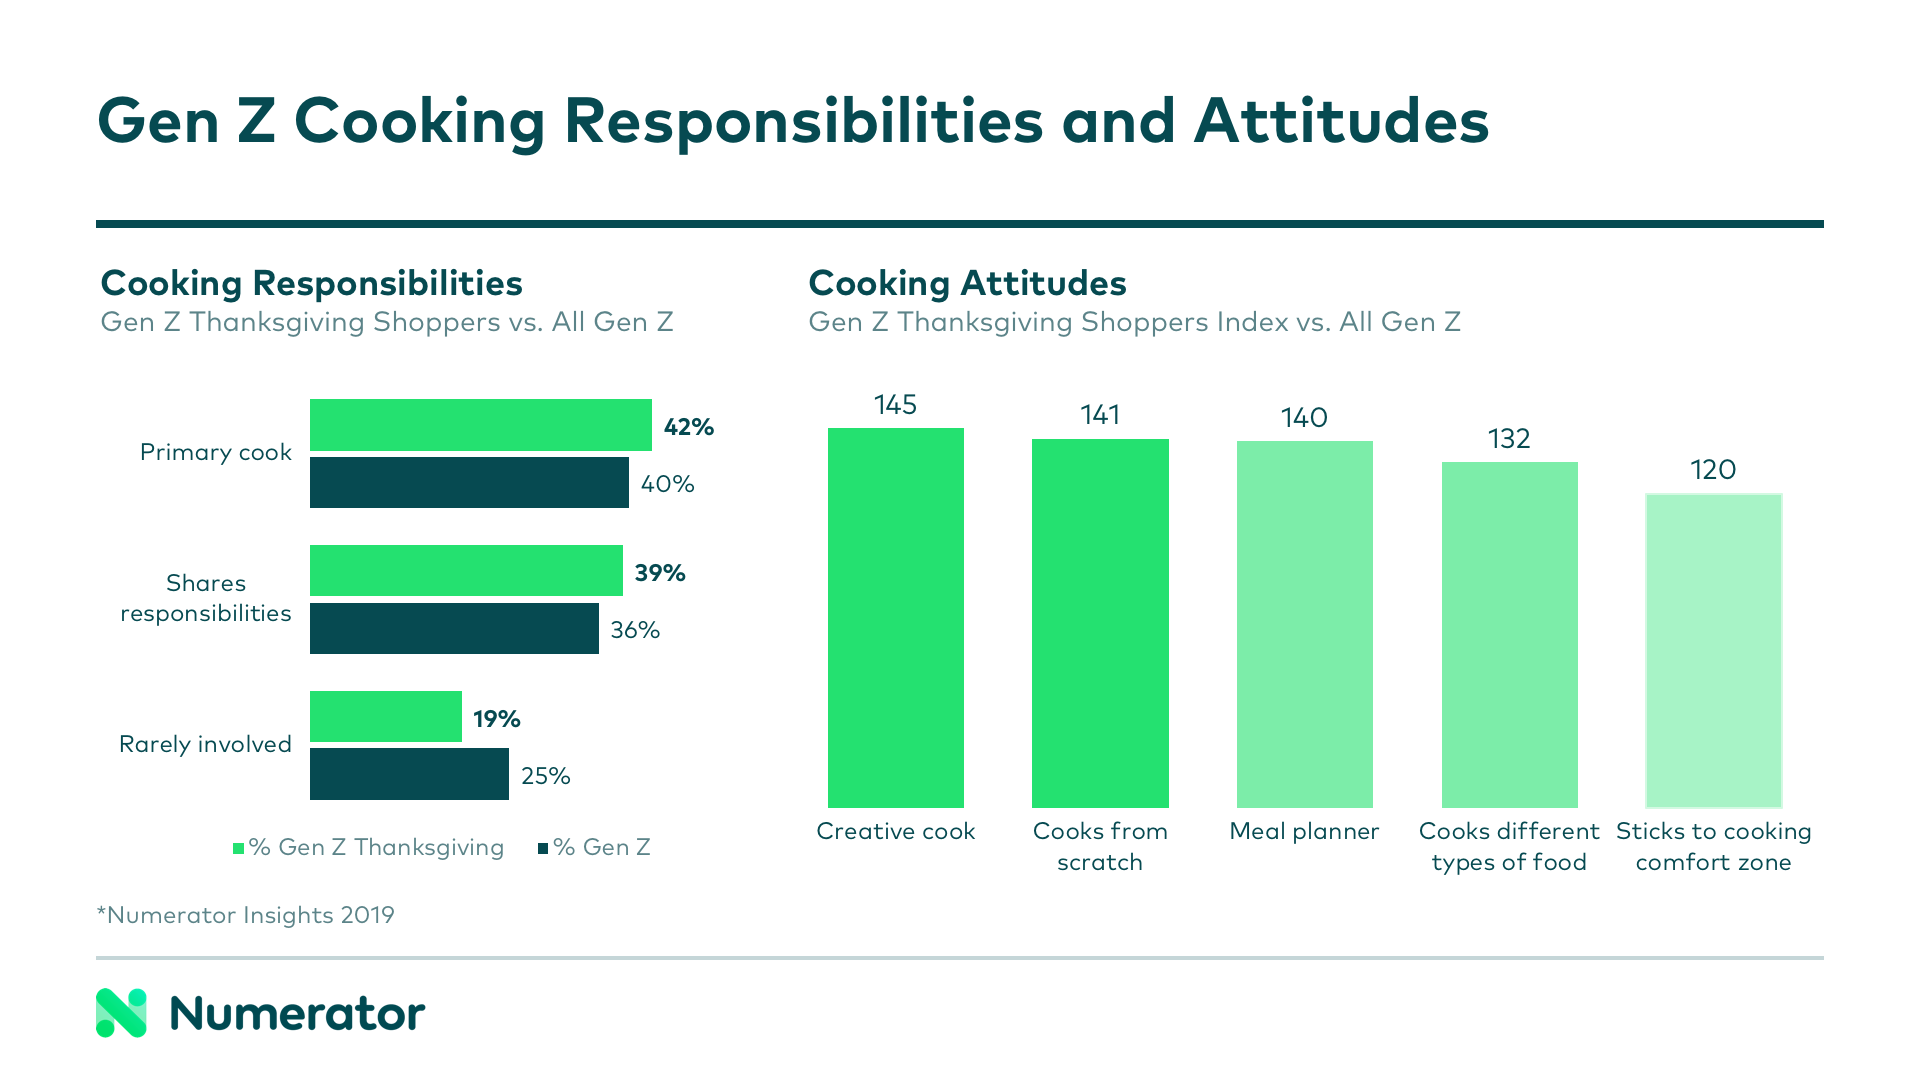
Last— and also least— was Gen Z with 2.7% of spend. Many of Gen Z’ers said they were rarely involved with cooking responsibilities for their households, and they were far less likely to be engaged with cooking activities across the board. As other generations ramped up spending on various components of a typical Thanksgiving feast, Gen Z over-indexed on snack categories and energy drinks.
Overall, only about 30% of Gen Z’ers said they participated in Thanksgiving shopping last year. Those who did participate were more likely to be the primary meal maker in their household, to enjoy cooking different types of food from scratch, and to consider themselves creative cooks. They were also more likely to be meal planners and to describe themselves as “guilt-ridden when not cooking.”

A Thanksgiving feast is not complete without all the sides and fixings, just as your consumer and shopper insights are incomplete without a proper view of everything from purchase behavior to psychographics. The holidays are not only a peak period for sales, but also for consumer engagement and acquisition. Knowing who to target and how to appeal to them will set you up for success well beyond when the leftover turkey runs out.
How will your brand or category fare as younger generations grow in buying power? Are you ready to adapt to shifting tastes and preferences, especially at peak sales periods like the holidays? Do you know who your consumer is and what they care about?
For a deeper look at any of these insights, or to begin digging into the data for your own brand or category, reach out to Numerator today.

