When tax season kicked off this year, there seemed to be a general sense that refunds would be much lower than normal and that it would have a negative impact on consumer spending. But according to the latest IRS statistics, as of March 22nd, 80.7% of processed tax returns have resulted in a refund, down only slightly (-0.5%) from this point last year. The average refund size this year is $2,915, down $10 (-0.3%) from last year.
While these numbers are likely to fluctuate some as we approach the April 15th tax deadline, it’s probably safe to say that number of refunds and refund size are not going to be wildly different than they have been in prior years, and that the early frenzy over smaller tax refunds was much to do with nothing. This still begs the question, though: How do these tax refunds impact consumer spending? According to our data, the answer is, “not much.”
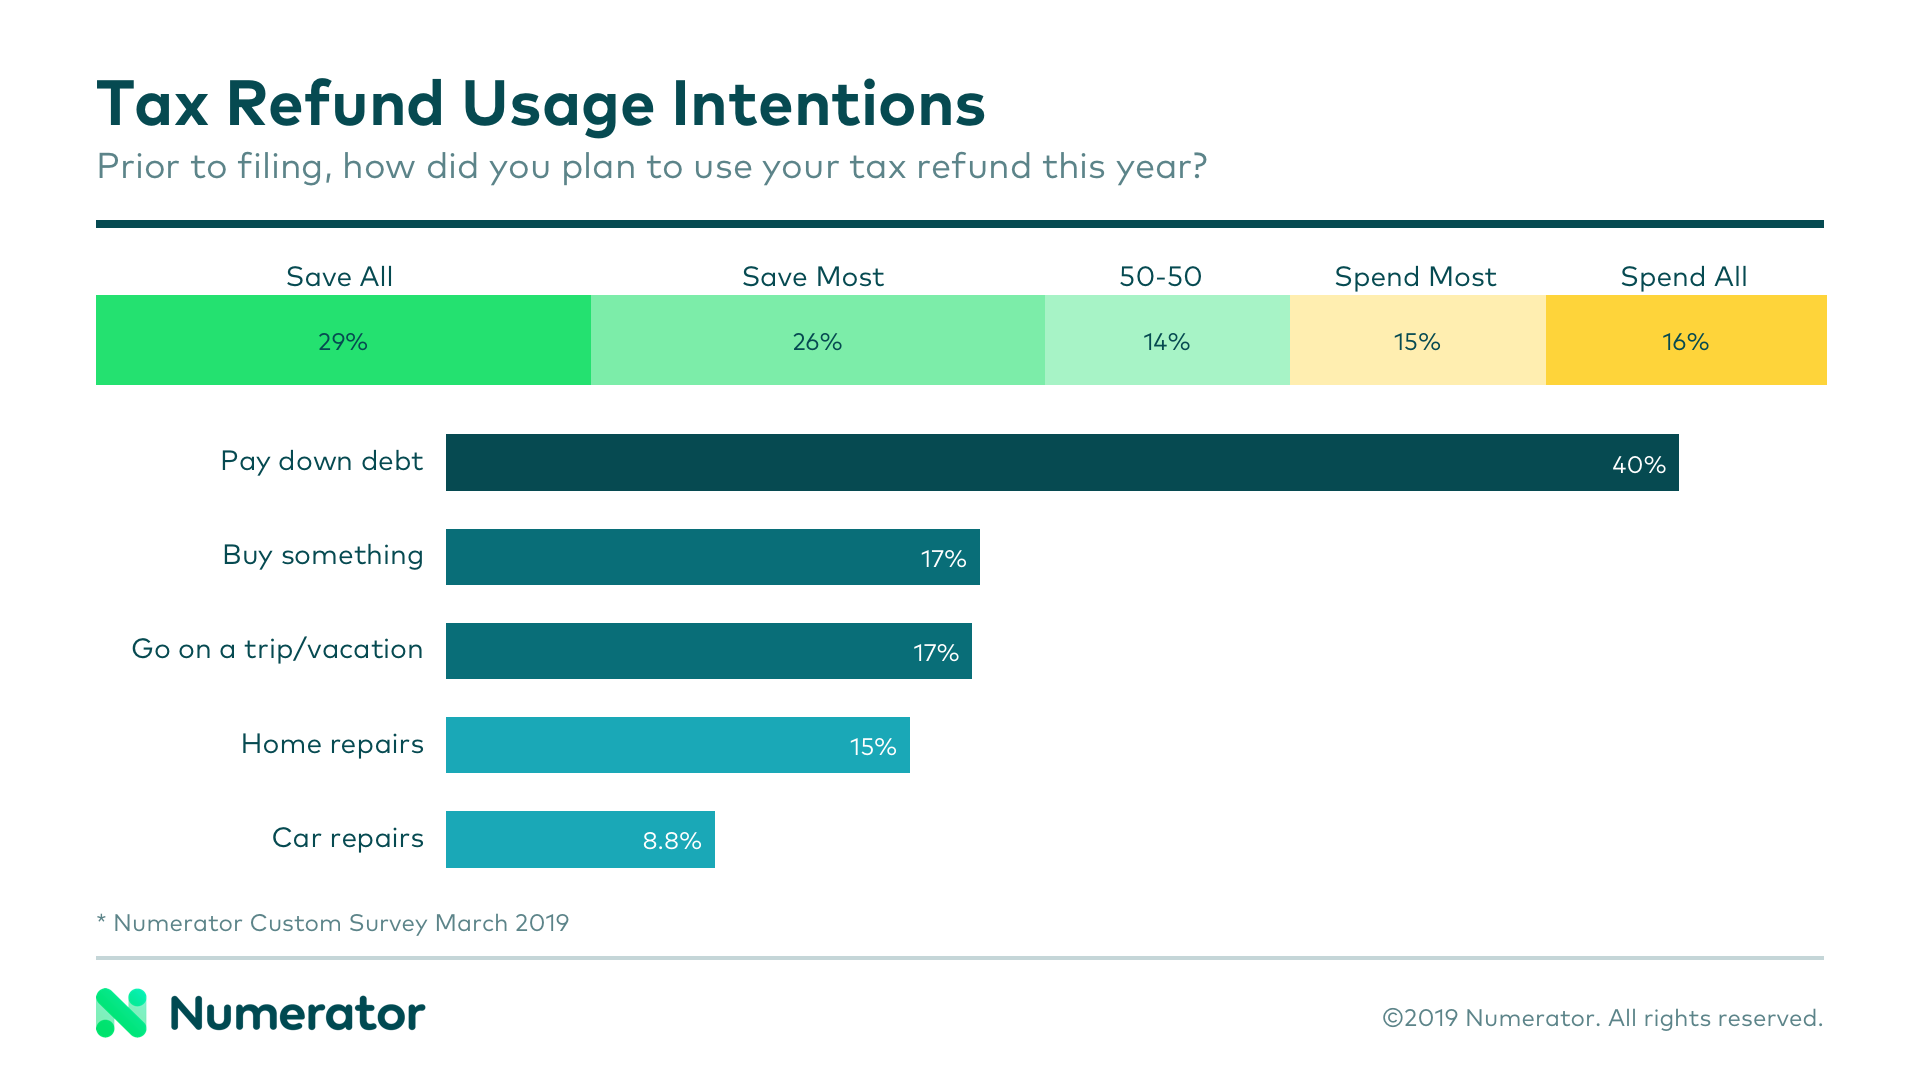
The overarching finding from our analysis of Numerator Insights data was that there is not a significant boost to consumer spending during tax season, despite a large number of individuals with extra money in their pockets. This likely ties back to the fact that over half (55%) of individuals plan to save all or most of their tax refunds, according to a Numerator fielded survey. Further, of those planning to spend their refund, 40% said it was to pay down debt, while only 17% planned to use it to buy something for themselves or their family.

Electronics are often thought of as one of the top categories to benefit from tax refunds. Numerator Insights data does show a slight increase in the sales of computers and gaming products during the month of March when many individuals receive their tax refunds, but other electronics don’t experience the same boost. Categories like appliances and home improvement tools did not show a notable rise during tax season either, though home and car repairs are commonly cited as intended uses for tax refund dollars.
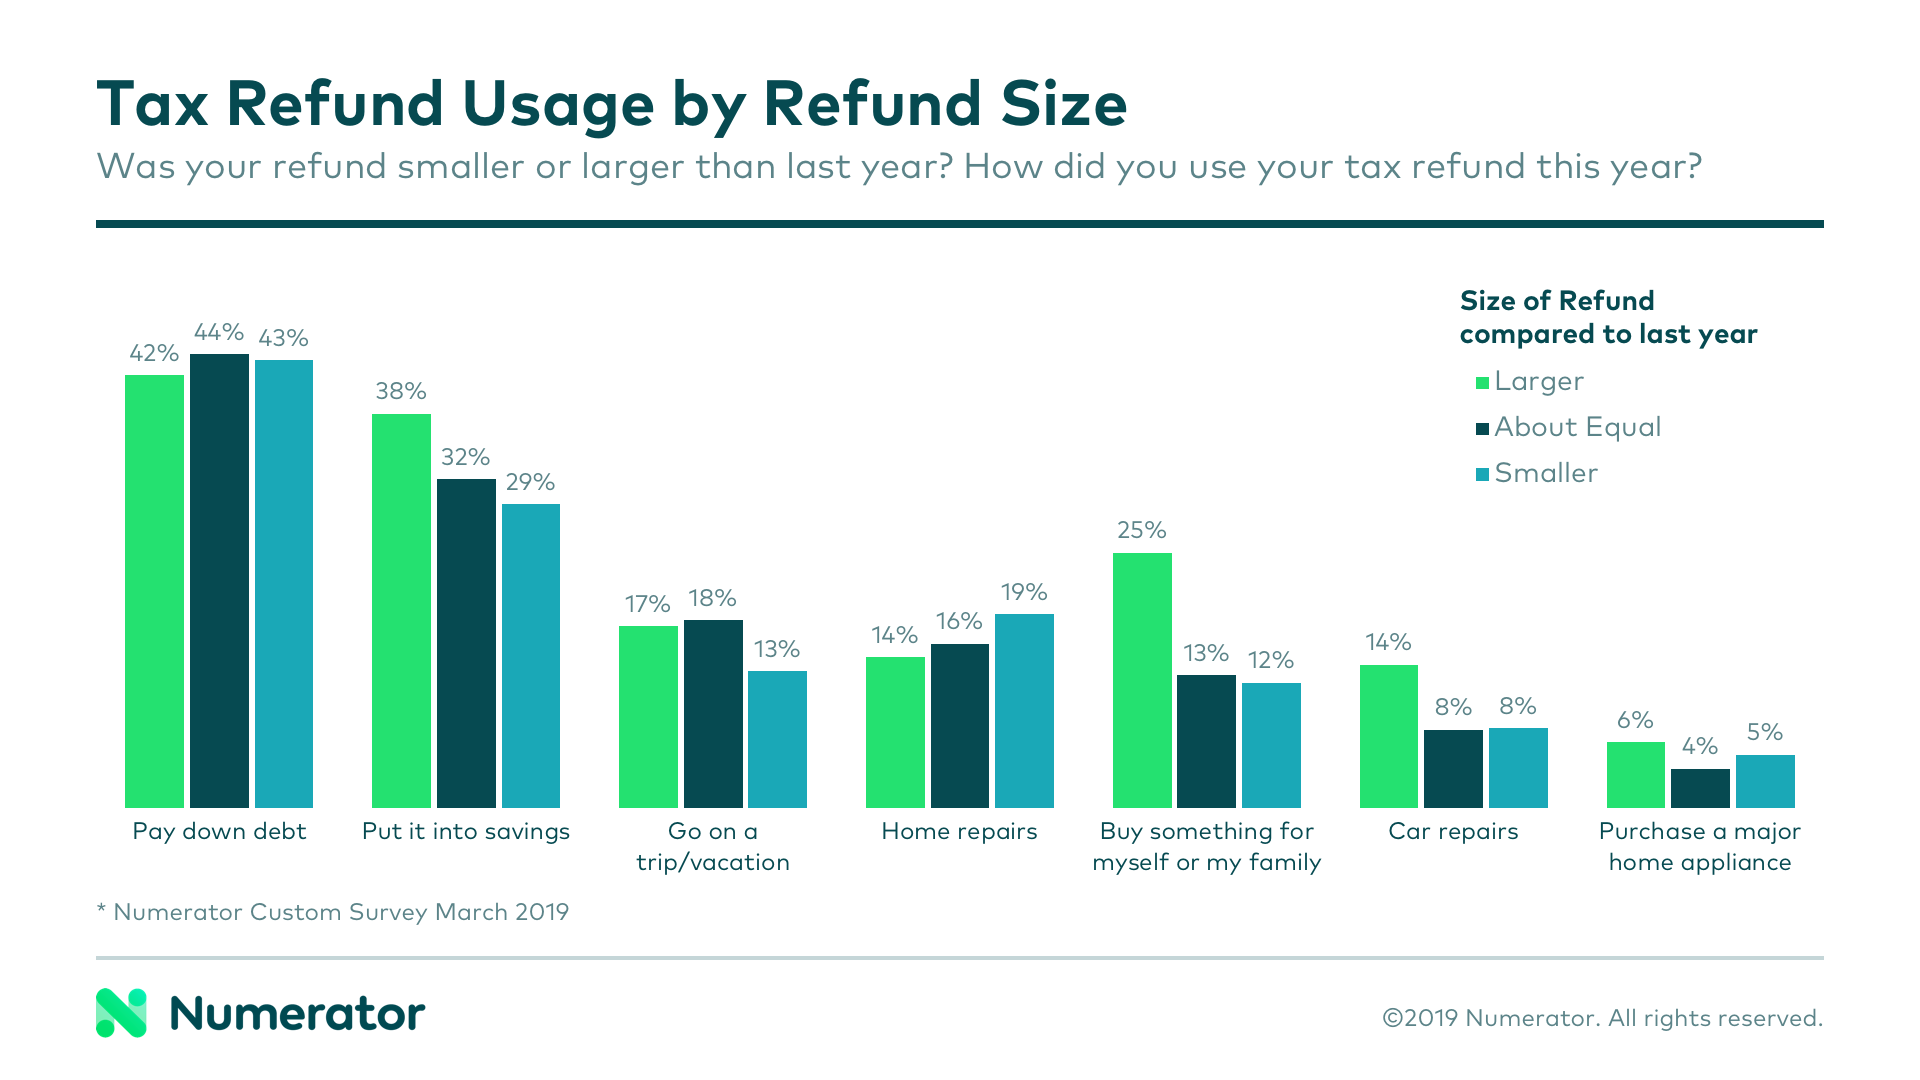
91% of individuals who received a refund on their taxes last year received one this year as well. Size of refund— more specifically, size as it related to last year’s refund, seemed to be a slight indicator of spending intentions. Those with a larger refund this year (30%) were more likely to put it into savings (38%) or to buy something for themselves or family (25%). Those with smaller refunds (34%) were likely to use it to pay down debt (43%).

Income level also tended to be an indicator of spending intentions. While high-income individuals were more likely to put their refunds towards home repairs or savings, low-income individuals were likely to spend on car repairs or buying something for themselves or family.
So, what does this all mean for manufacturers and retailers? Since the default instinct of many is to save their refunds or use them to pay down debt, the amount of leftovers up for grabs is much less than some may hope. To capture these elusive refund dollars, businesses must really understand their shoppers— their demographic makeup, where they like to shop, and which forms of media they’re most likely to leverage for shopping and product research.
To learn more about Numerator and how we can help you to better understand the who and the why behind the buy, contact us today.

