In five short years since its first go-round, Amazon Prime Day has quickly become an established retail holiday, consistently inching closer to the likes of Black Friday and Cyber Monday. It’s an epic feat of advertising and price promotions, and it appeals to the tech savvy, deal savvy shopper. What did we see from Prime Day 2019 and how did it compare to years past?
Check out more up to date Prime Day coverage here!
The power of Prime Day is undeniable— a chance for Amazon to make new friends, strengthen bonds, and expand their army of Alexas. To pull off such an event requires elaborate planning and advertising, both to build excitement and to convert that excitement into sales.
Using Numerator Ad Intel, Pricing, and Insights data—featuring a custom survey of 1000+ verified Prime Day 2019 shoppers— we were able to get a full look at Amazon’s Prime Day journey; from the build up through execution, and finally—most importantly— what shoppers bought and what they thought of the whole thing.
Prime Day goes Prime Time
According to Numerator Ad Intel data, Amazon’s overall ad spend for the two weeks leading up to Prime Day only increased about $4 million in 2019 versus 2018. However, digging deeper into the distribution of those ad dollars reveals a significant shift in Amazon’s allocation strategy, with far more dollars going to mobile and TV ads in 2019 than in years past.
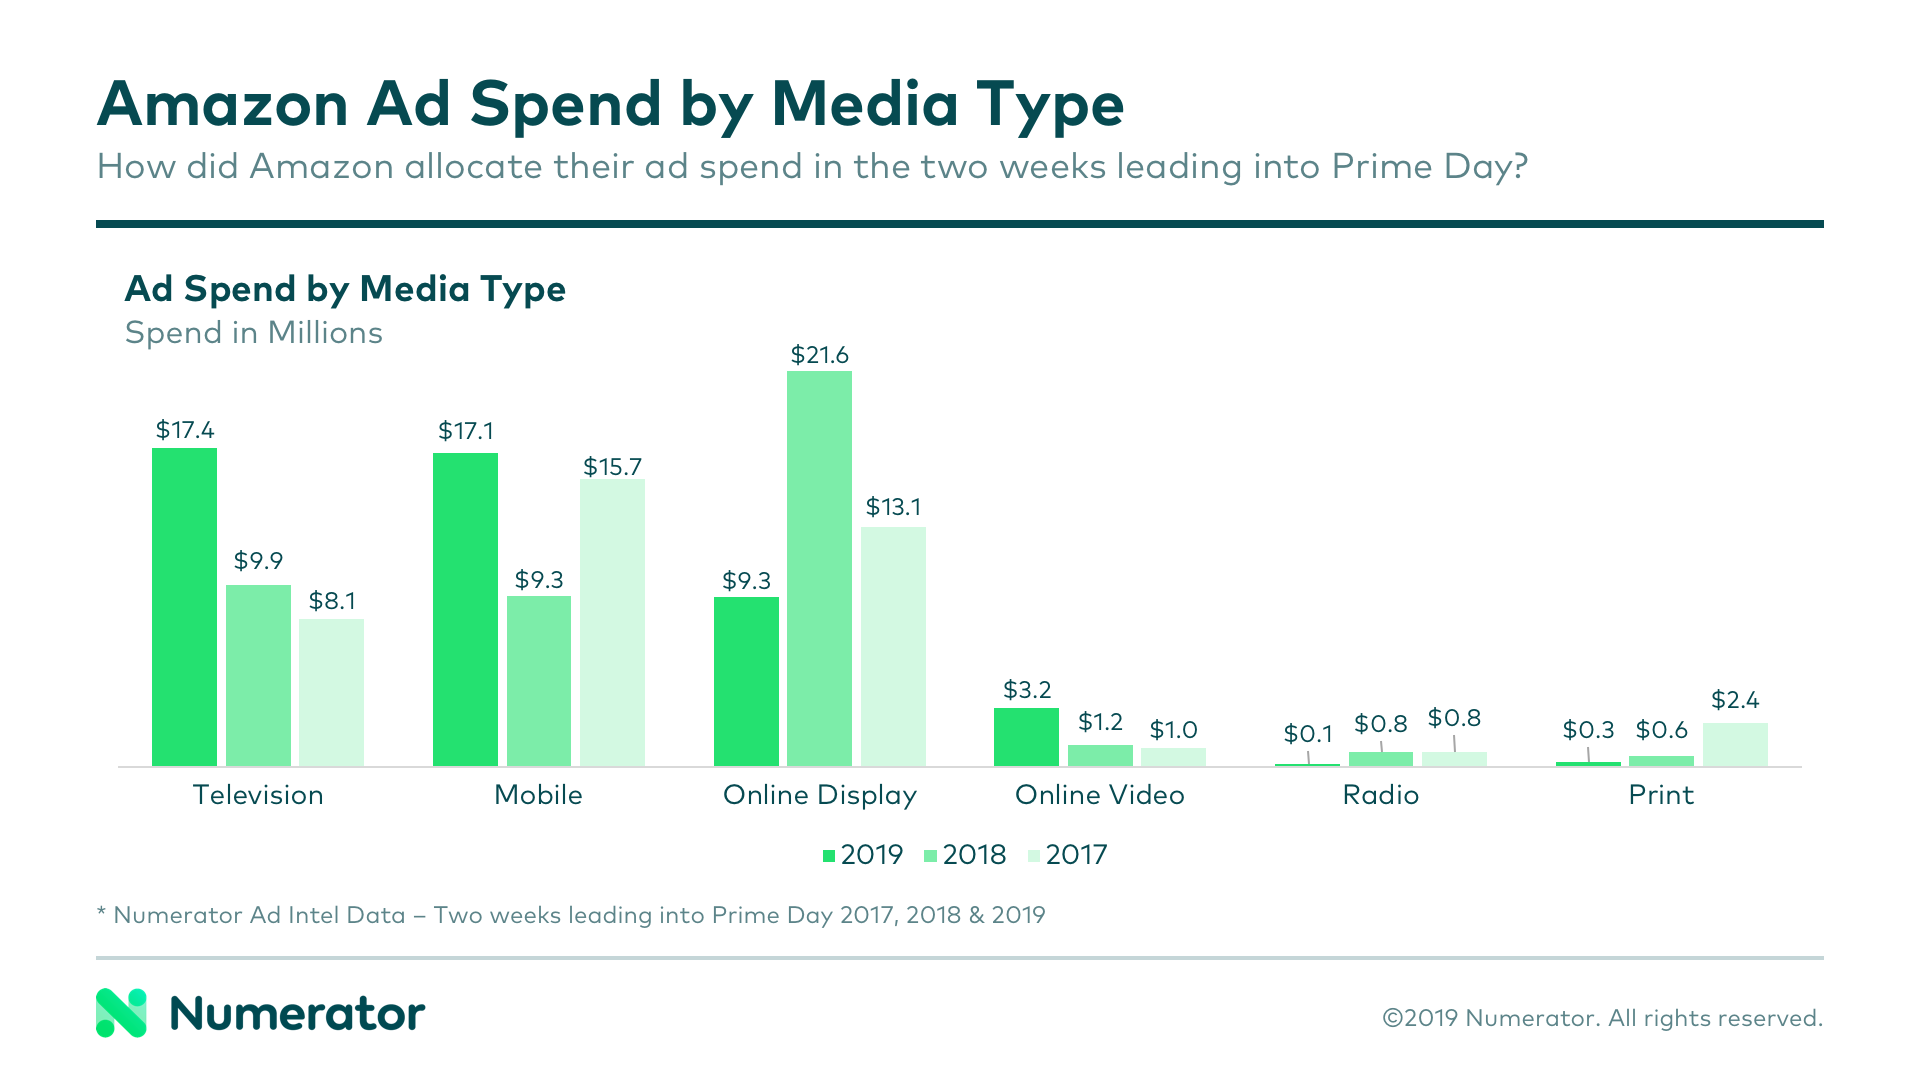
The shift to mobile seems fitting, given shoppers’ increasingly heavy reliance on their mobile devices as sources of information and vehicles for shopping. In fact, in our survey of verified Prime Day shoppers, roughly 70% indicated they did their Prime Day shopping via mobile devices.
The other major shift we saw in spending was Amazon’s investment in TV advertisements. While the number of unique ads declined from 18 in 2018 to 15 in 2019, the occurrences of these ads nearly doubled, with almost twice as many ad runs (7,800) this year over last year (4,100). Despite this heavy spend on TV ads, the majority of Prime Day shoppers learned about Prime Day through the Amazon website (50%) or mobile app (43%), social media (46%), or a direct email from Amazon (40%), and only 17% from TV ads.
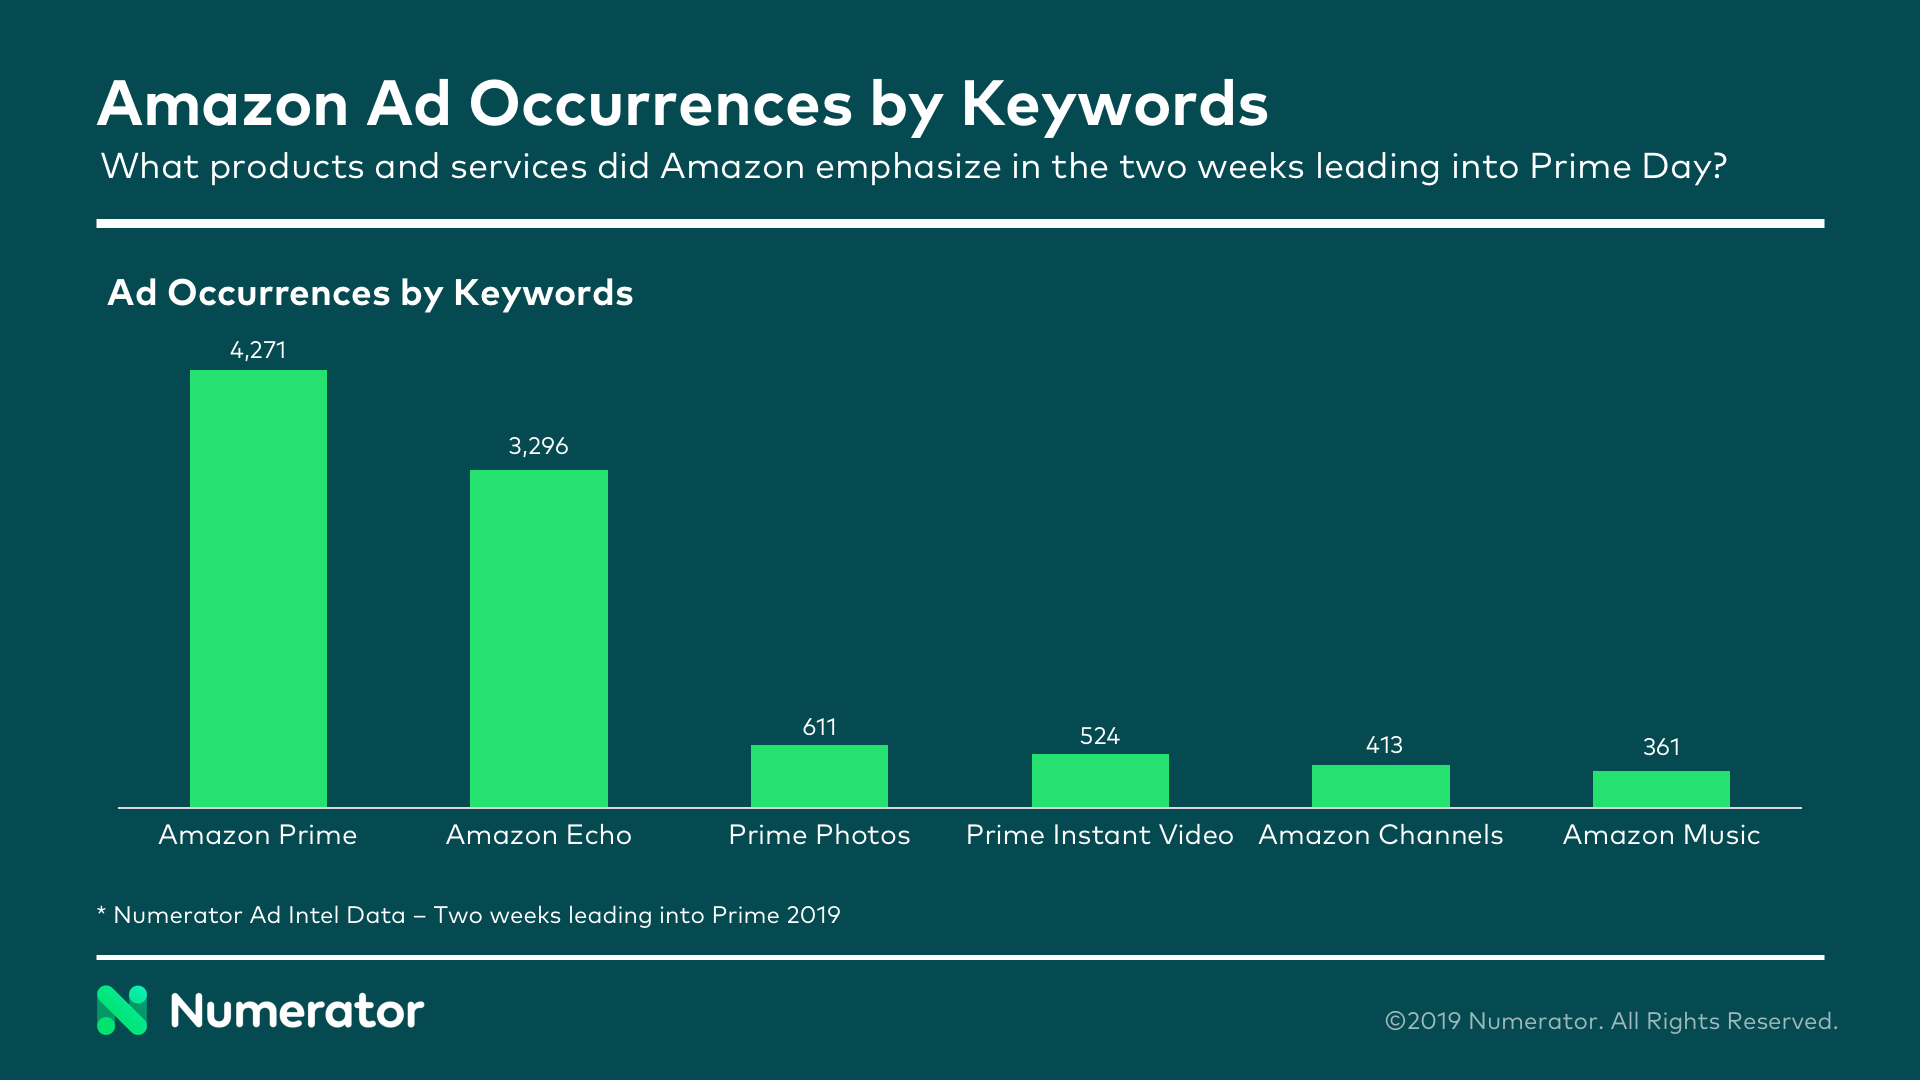
Amazon’s annual Christmas in July has expanded from one day to two in recent years, but shoppers won’t find turtle doves, french hens, or partridges in pear trees— they will, however, find plenty of Amazon products. The top two most frequently advertised keywords in the weeks leading up to Prime Day were Amazon Prime itself and the Amazon Echo, the latter of which was identified by survey respondents as one of their top purchases during the two-day event.
Prime Day Discounts
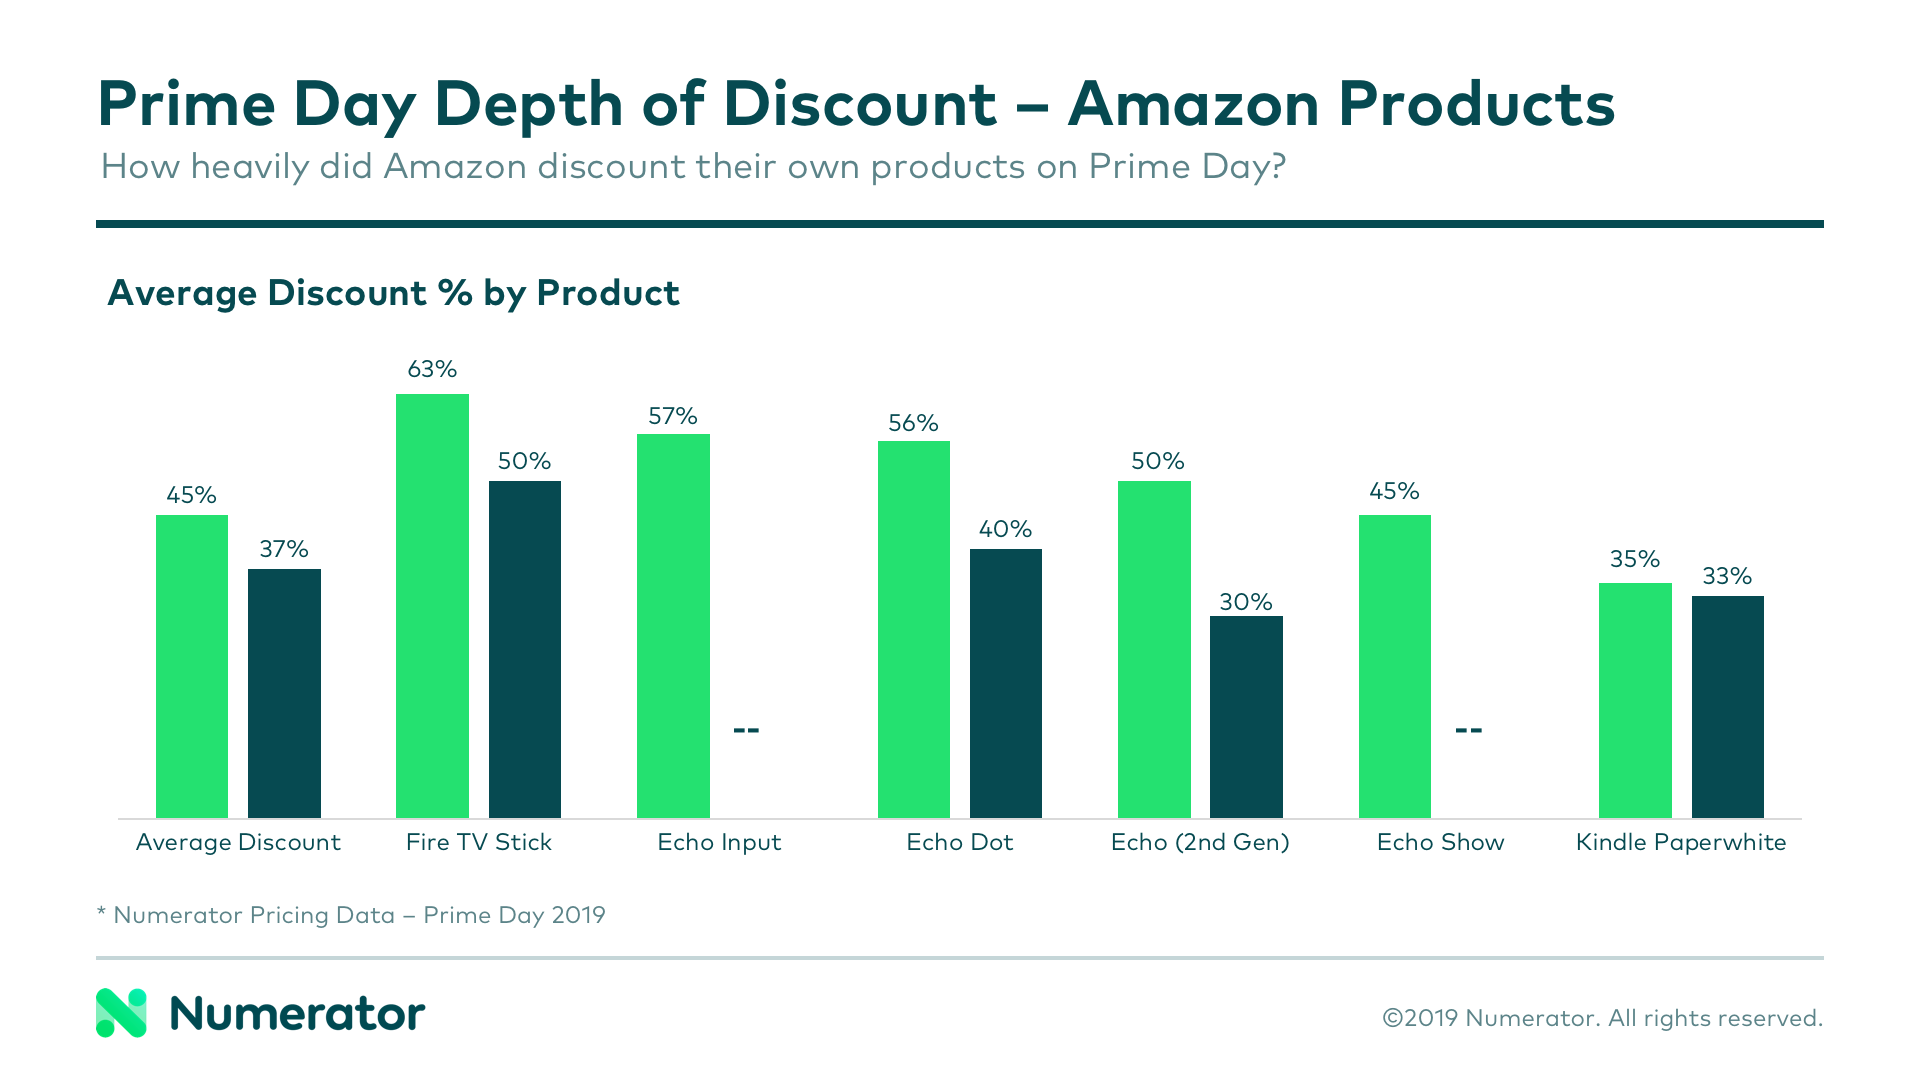
There were some good deals to be had this year on Prime Day— if shoppers were looking to buy into the Amazon ecosystem, that is. Depth of discount on Amazon ecosystem products averaged 45% this year, compared to 37% in 2018. Echo, Fire TV, and Kindle products were all offered at the deepest discounts seen to-date. Additionally, Alexa-enabled products averaged a slightly higher discount of 32%, and many deals on these products— like an Alexa-enabled Instant Pot— included the Echo or Echo Dot as a bundled package.
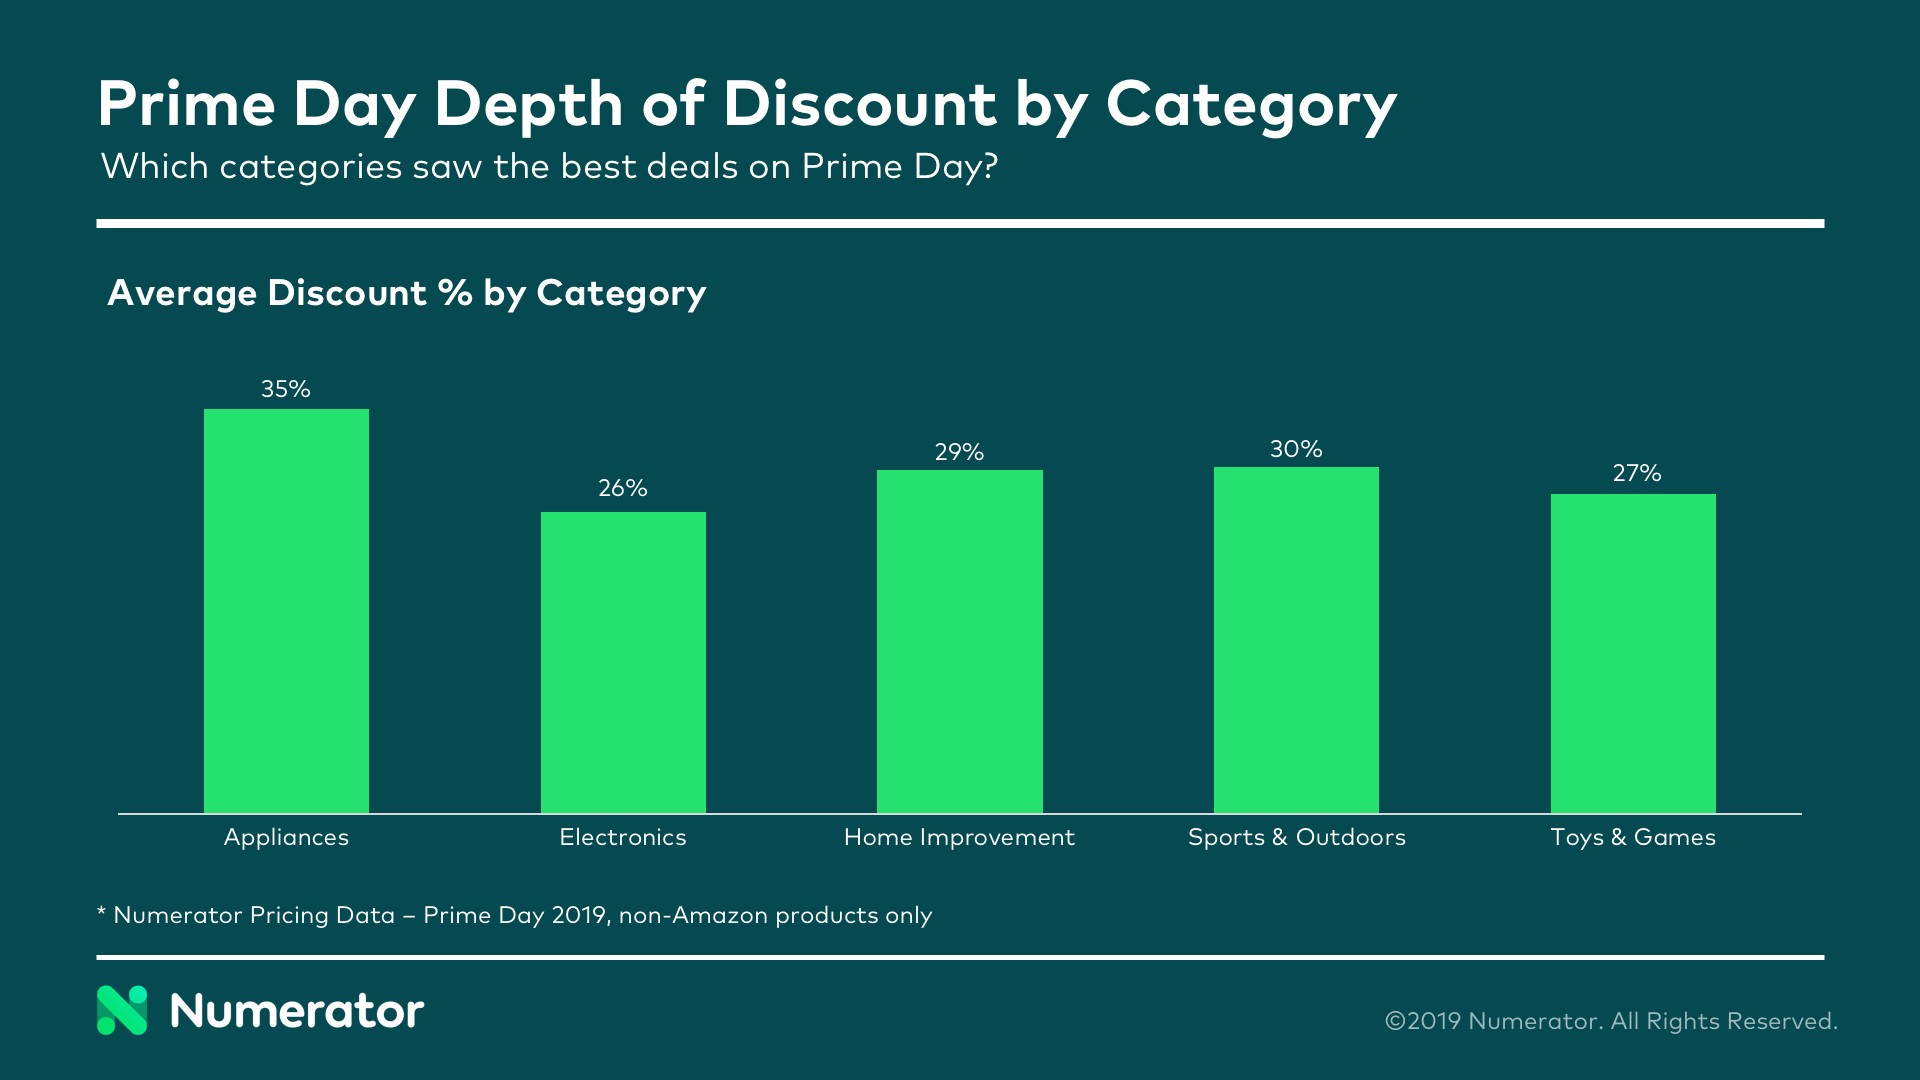
For non-Amazon branded products, the deals were not quite as juicy. In fact, for the ~200 Prime Day 2019 deals observed by Numerator, the average discount was only 31% (down from 36% in 2018). This in-part reflects the wide and varied nature of Prime Day deals in terms of both discounts, which can range anywhere from 5% to 80%, and assortment. When breaking down by category, we saw the heaviest discounts on appliances, and the lowest depth of discount on electronics.
Though the discounts we observed may not have been as deep as they were in 2018, consumer perception is the true test of a good deal. So what did shoppers think of Prime Day this year? 65.8% said they were extremely satisfied or very satisfied with the deals offered, and 59.8% said the same for the selection of products offered.
In relation to other retail holidays, this year’s Prime Day shoppers ranked Prime Day #2 in terms of deal quality, behind Black Friday and ahead of Cyber Monday. Last year, we reported that Prime Day ranked below both Black Friday and Cyber Monday in terms of perceived deal quality, so this year’s shake-up proves Prime Day’s growing popularity.
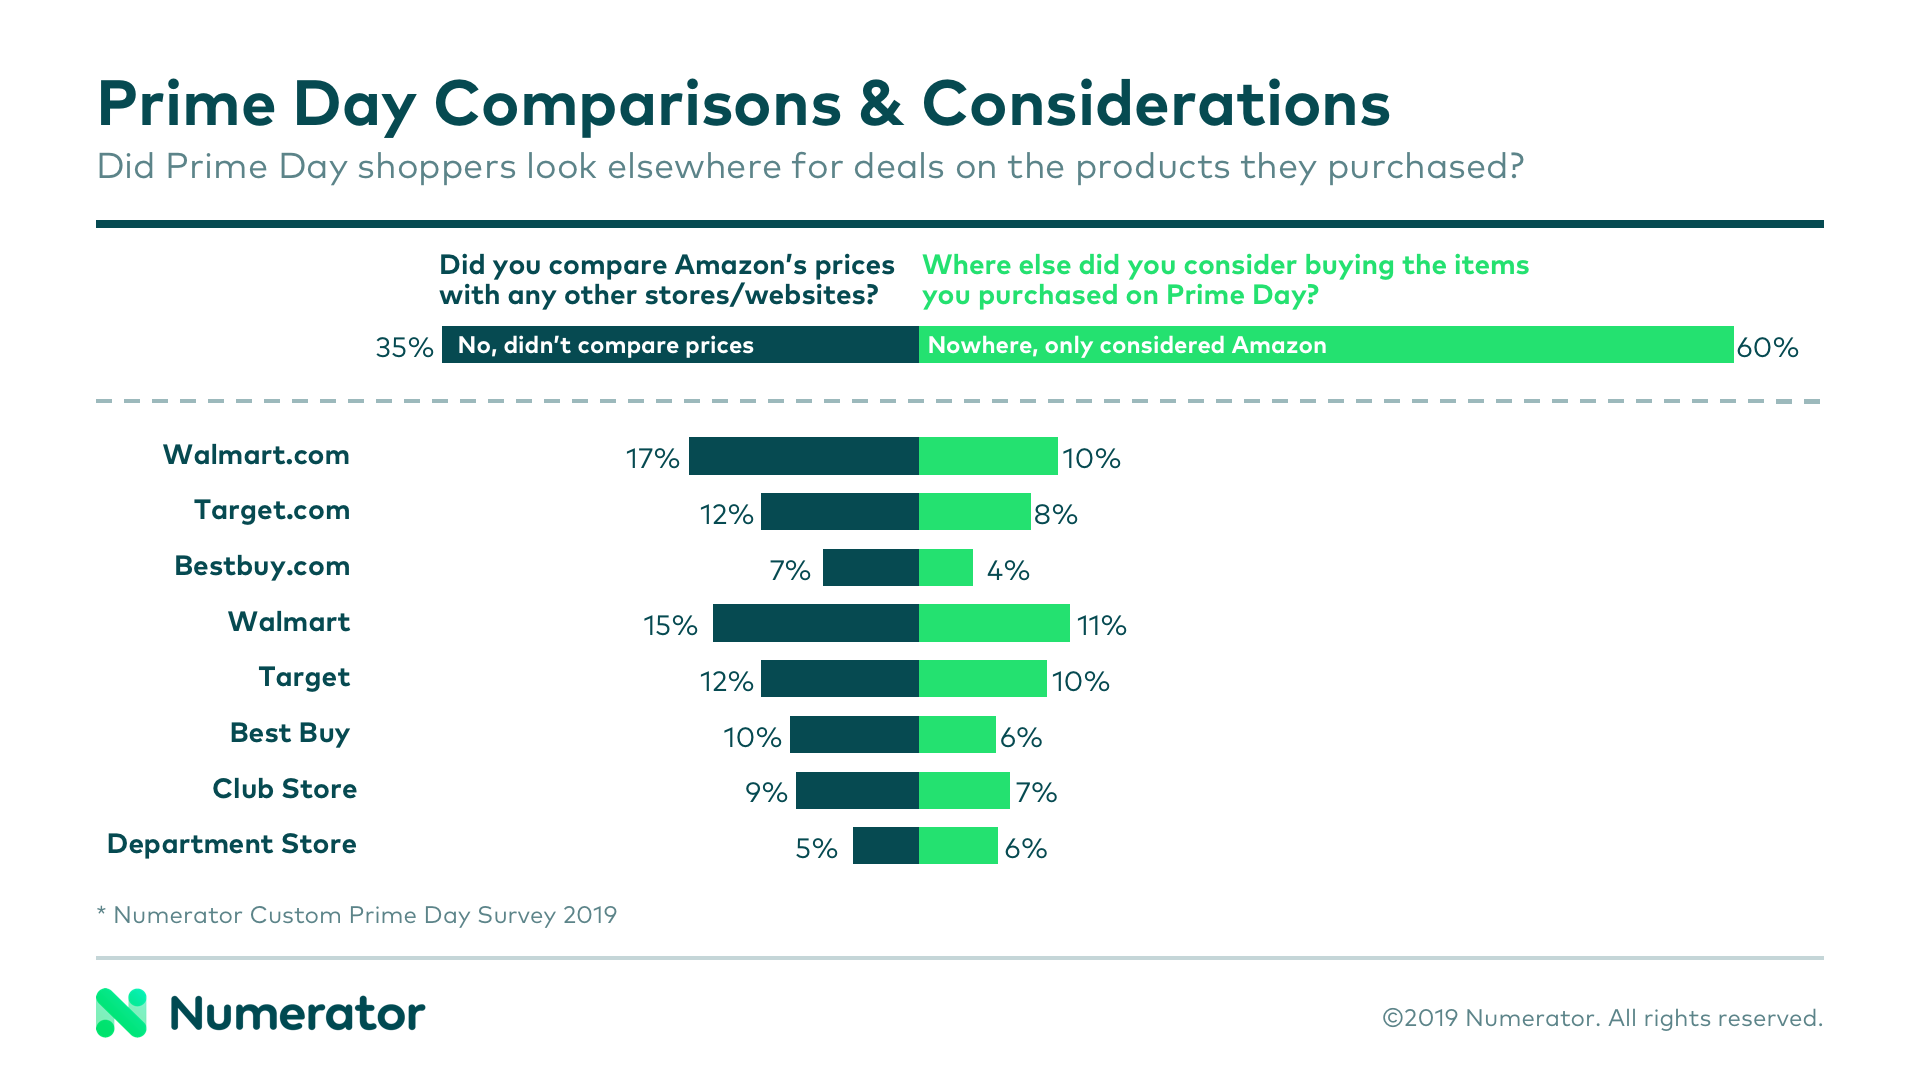
When it came to ‘shopping around’ for the best deal, Prime Day shoppers said, “no thanks!” The majority of shoppers (60%) only considered Amazon for the products they ultimately ended up purchasing on Prime Day. 35% didn’t compare Amazon’s prices to any other stores or websites, putting their faith in Amazon to give them the best deal. For those who did compare, the most popular websites to check out were Walmart.com (17%), Target.com (11.7%) and BestBuy.com (7.1%).
Perspectives from Prime Day Shoppers
For 36% of Prime Day shoppers, this year was their first time shopping Prime Day— that’s down from last year’s 44%, but still a significant number of newcomers to the day of deals. 58% of Prime Day shoppers participated in 2018 as well, and 12% of this year’s shoppers participated in the first ever Prime Day back in 2015. Amazon has succeeded not only in attracting first-timers, but also in maintaining loyal enthusiasts.
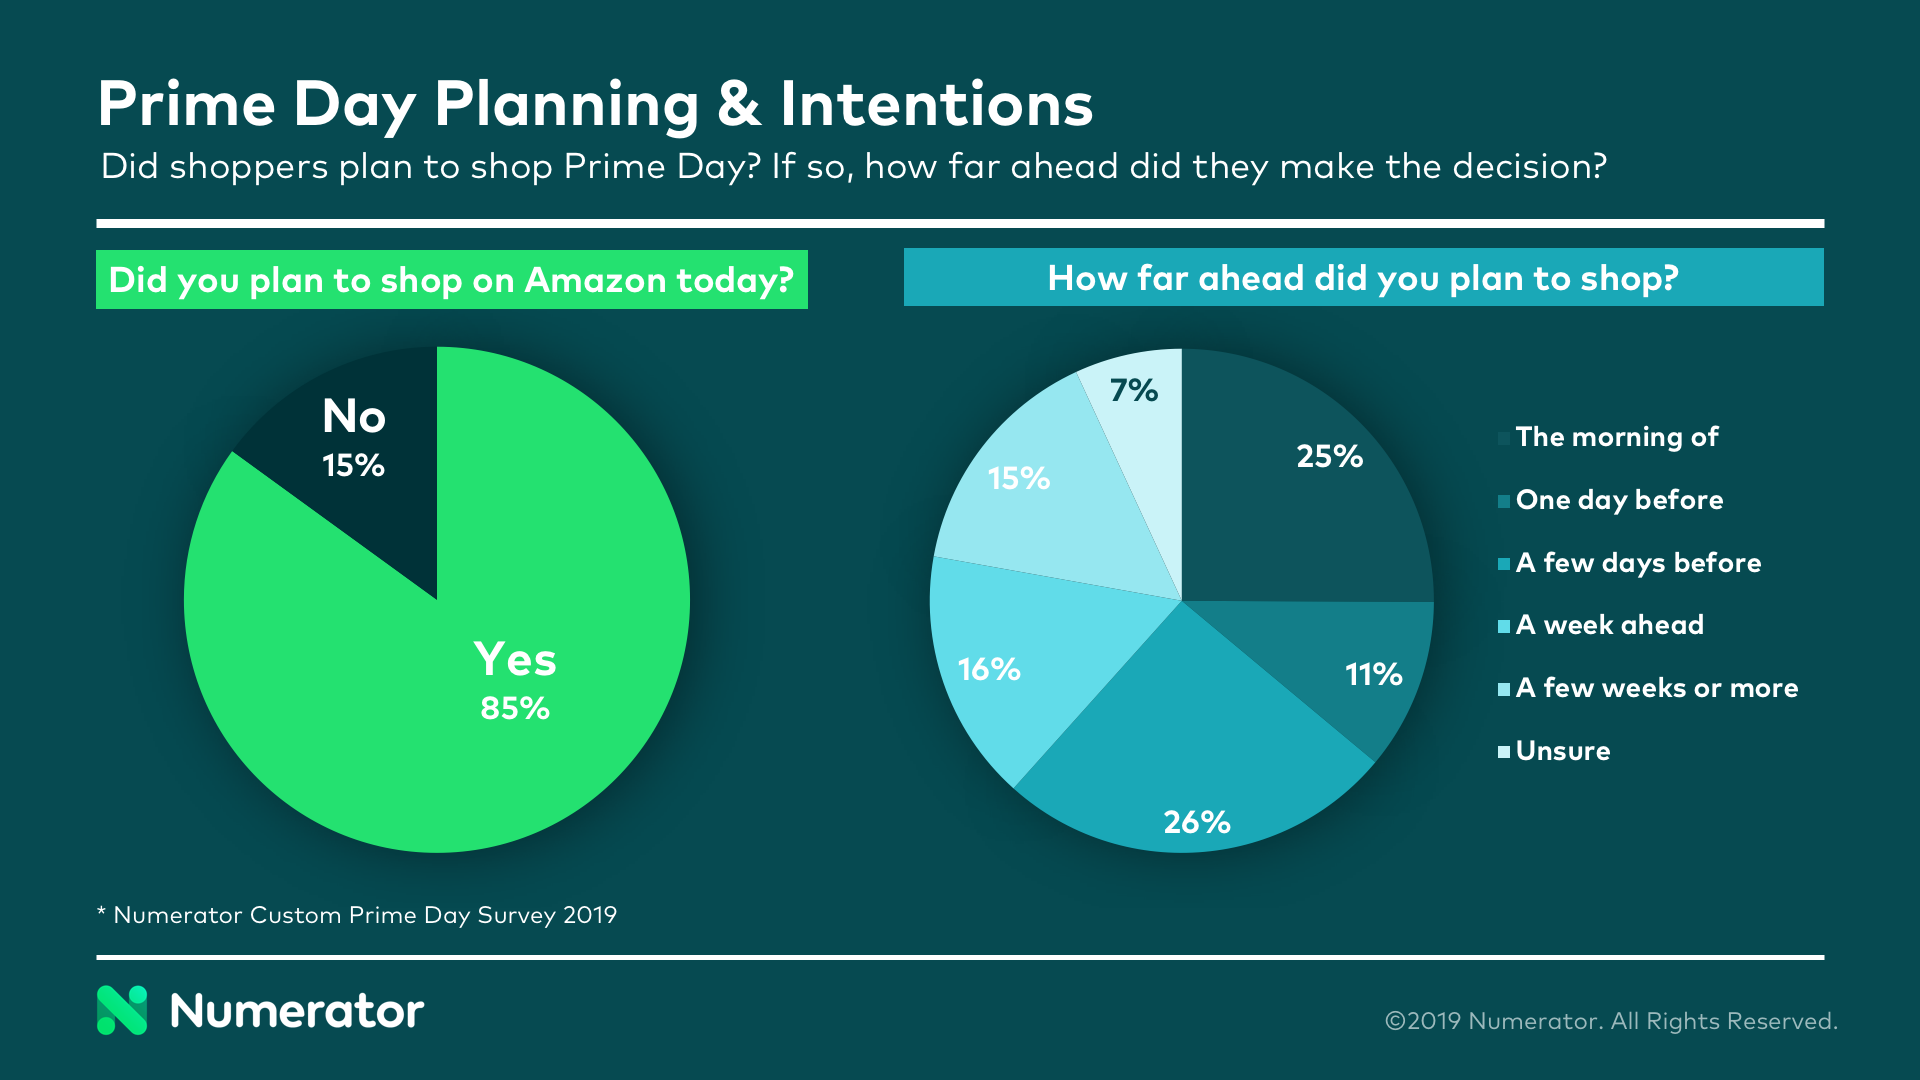
85% of shoppers who made an Amazon purchase during Prime Day planned ahead— if only slightly— to make that purchase. For the other 15%, it was a spontaneous choice. Among those who planned to shop Prime Day, 25% decided the morning of, and another 37% decided less than a week before. Clearly, many shoppers are coming into Prime Day with little-to-no forethought or planning— a perfect opportunity for Amazon to capture impulse buys.
Prime Day was the primary or driving factor in over 90% of Amazon shoppers’ purchases on July 15th and 16th. Enticed by the deals and entranced by the experience, the average shopper spent close to an hour shopping Prime Day. People were more likely to shop at home (73%) than at work (30%) and favored mobile (70%) over computers (34%)— granted, for some, multiple methods were used.
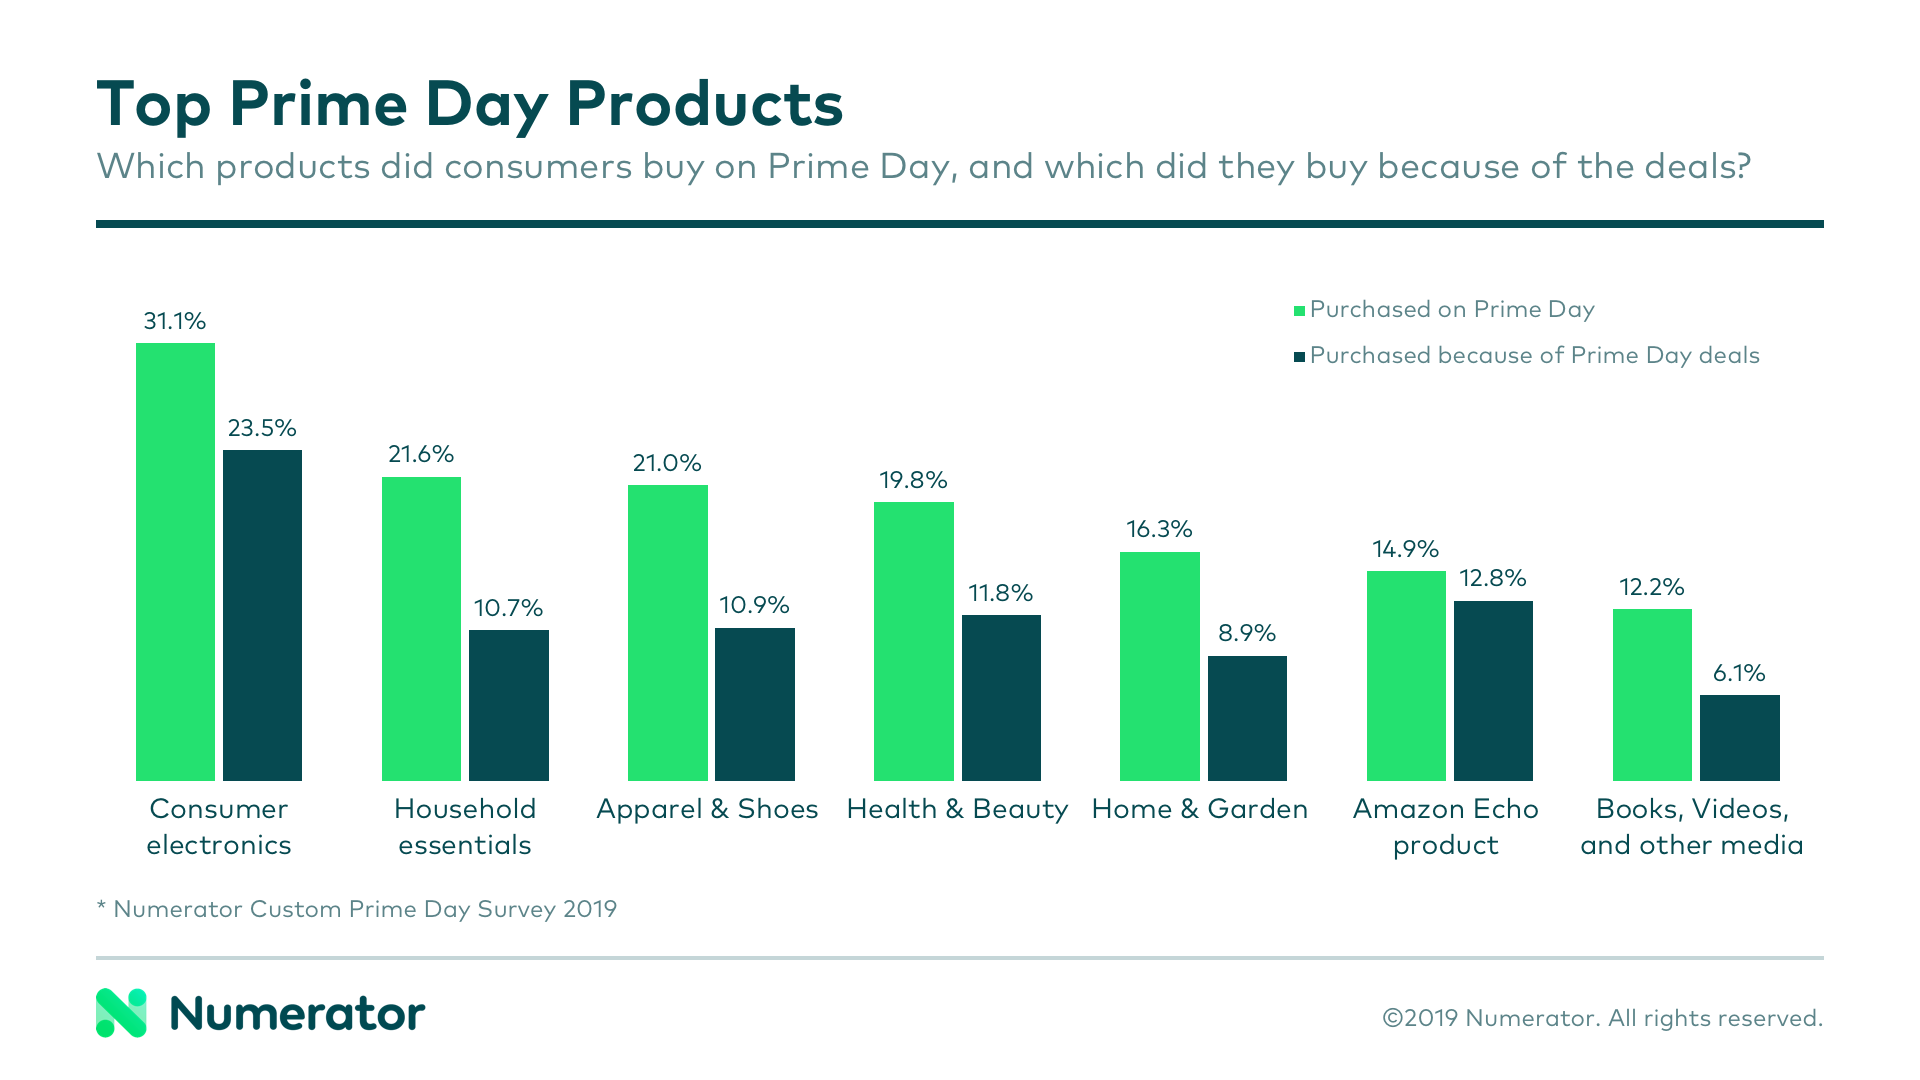
The top categories sold on Prime Day were consumer electronics, household essentials, and apparel & shoes. However, these weren’t necessarily the categories most heavily influenced by Prime Day. When asked ‘which of the products did you purchase specifically because it was on Prime Day,’ shoppers were most likely to answer consumer electronics, miscellaneous ‘other’ items, and Amazon Echo products.
So there you have it! Amazon’s heavy ad spend made way for a successful Prime Day, highlighted by heavy discounts on Amazon’s owned products, and capped with a slew of relatively satisfied consumers. As Amazon continues to grow their ecosystem of products and services, it seems that Prime Day will continue to serve as a means to attract and please new and existing Amazon shoppers.
Interested in learning more about Prime Day and how it impacted your brand? Contact us today!

