

Retailers invest significantly in loyalty: free rewards programs, paid memberships, personalized offers and exclusive perks have increasingly become table stakes for today’s shoppers. But today’s shoppers are spreading their spending across more retailers, making traditional performance metrics less reliable indicators of loyalty. To accurately gauge loyalty and make the most of their investments, retailers must adopt a more comprehensive approach to measurement.
Loyalty Trends at Top Retailers
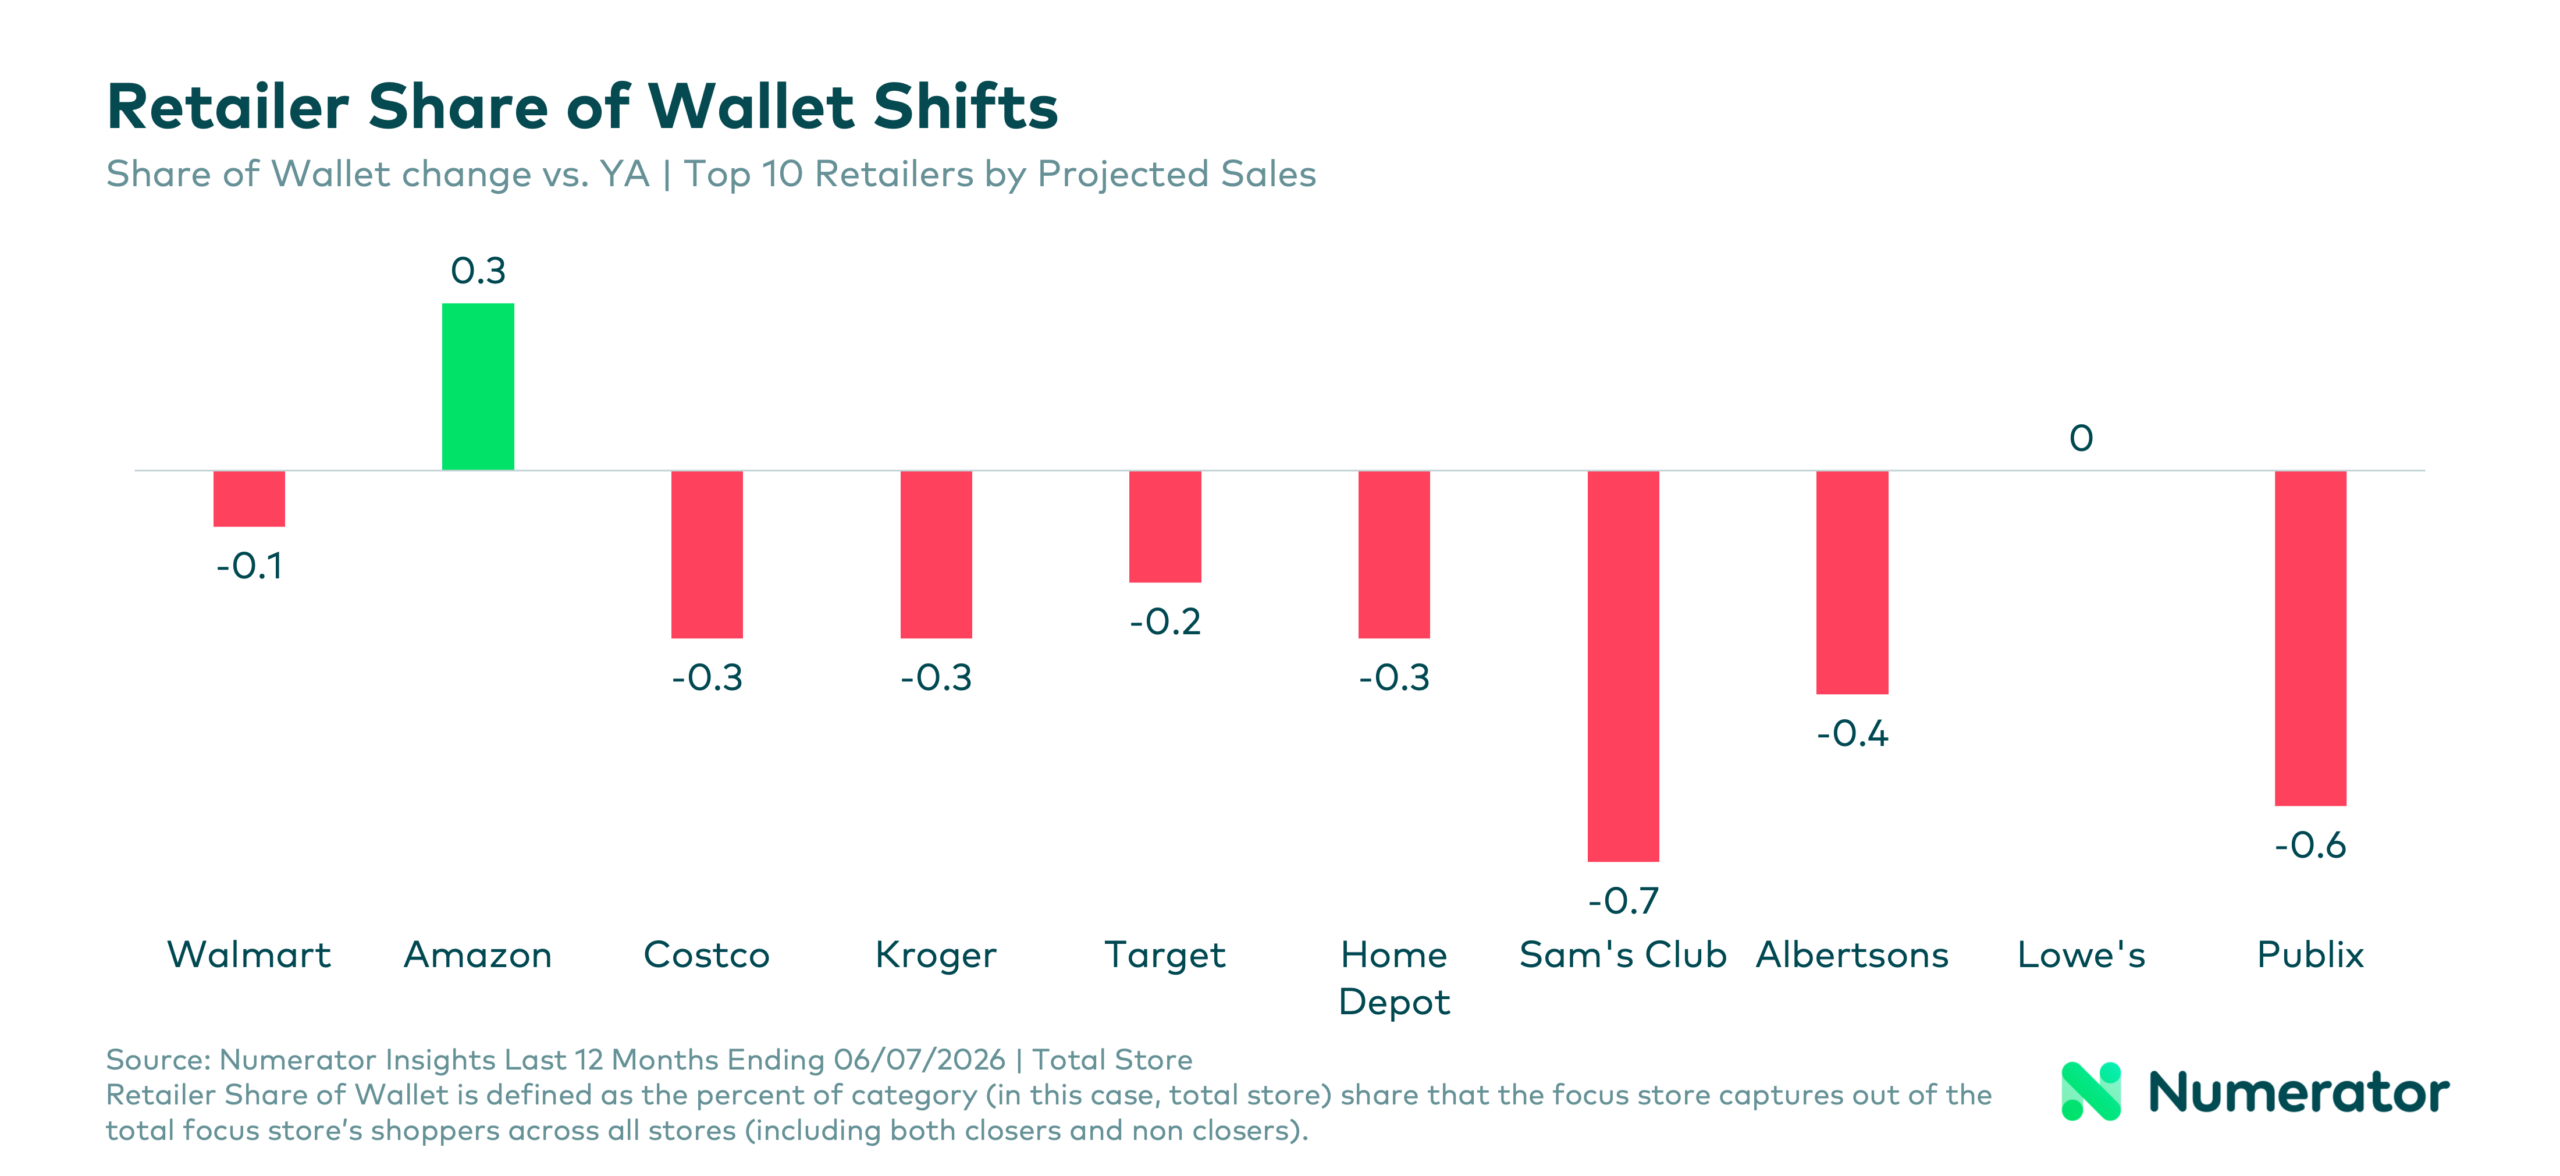
While loyalty programs are everywhere, consumer spending is becoming increasingly fragmented, as shoppers seek the best deals and have access to more retailers and channels than ever before. According to Numerator’s comprehensive consumer purchase data, over the last year, eight of the top 10 U.S. retailers experienced declines in shopper loyalty, measured by share of their customers’ wallets. Even retailers that are growing in terms of households, trips and sales aren’t necessarily capturing a greater share of their shoppers’ total spend.
Differentiating between Spend and Loyalty
Retailers have no shortage of internal metrics. They can track shopper households, purchase frequency, basket size, sales, and loyalty program enrollment with precision. These metrics are valuable, but they’re only part of the picture.
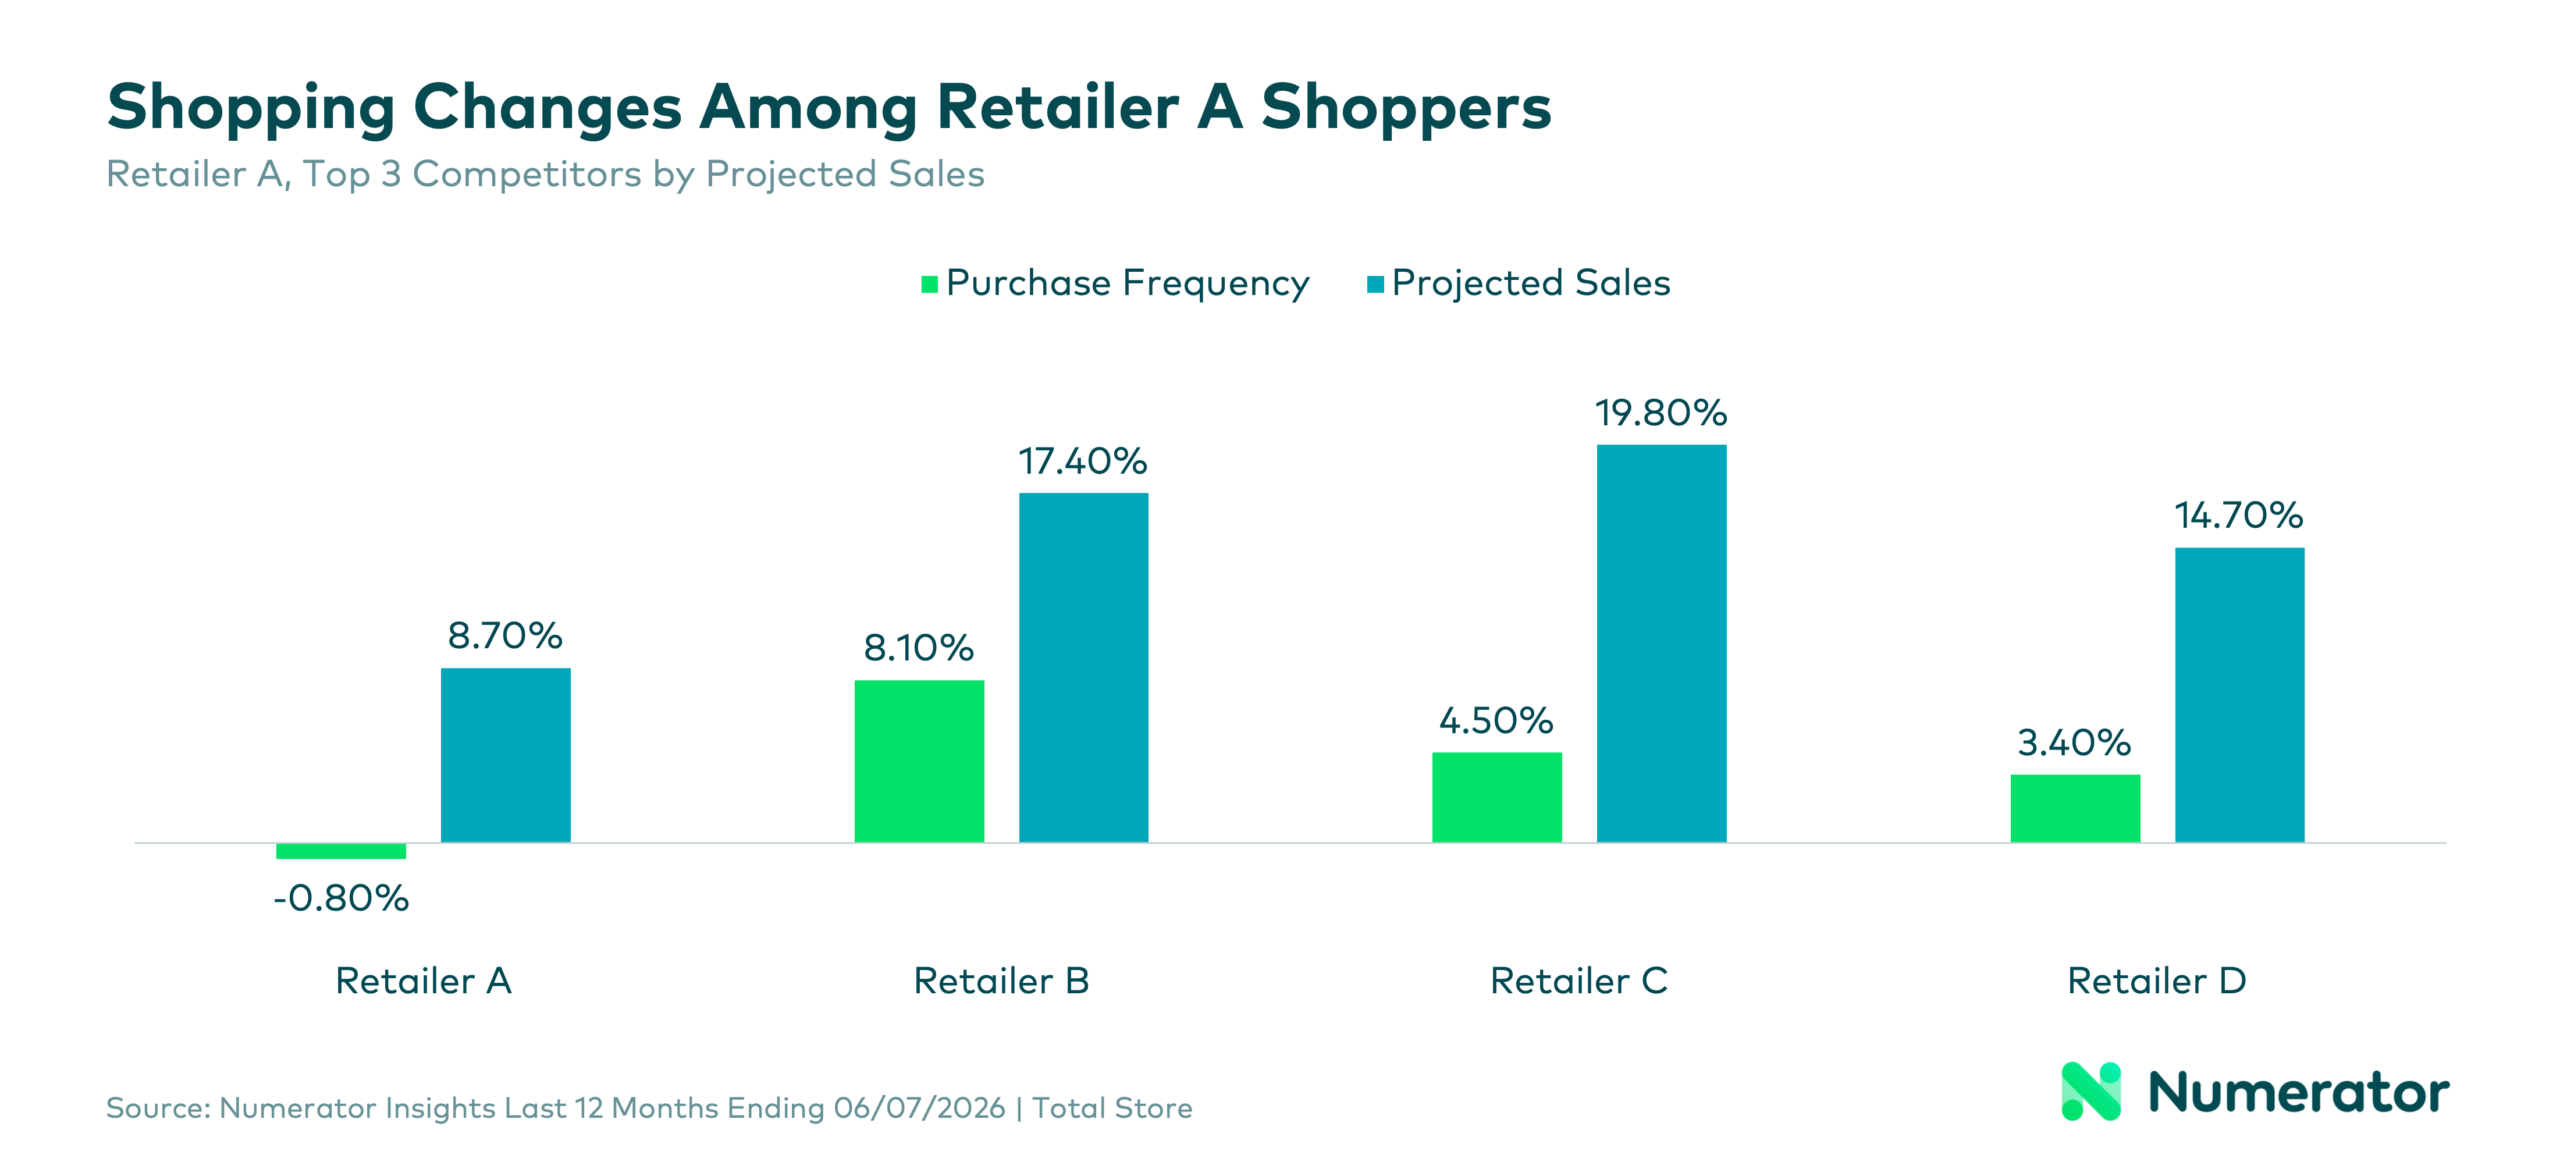
Consider one retailer (Retailer A) analyzed as an example. Looking only at an approximation of internal performance, Retailer A appeared to be performing well. Projected households increased 7.0% year over year, purchase frequency decreased slightly by 0.8%, and projected sales grew 8.7%. Despite spending more at Retailer A, shoppers weren’t becoming more loyal.
When we looked beyond Retailer A’s own walls, at the omnichannel purchase behavior of verified Retailer A shoppers, we found those same shoppers were increasing spending with competing retailers even faster. Purchase frequency at three competitors grew by 8.1%, 4.5%, and 3.4%, respectively, while projected sales increased at those retailers by 17.4%, 19.8%, and 14.7%, far outpacing growth at Retailer A.
Without understanding how shoppers behave across the broader retail landscape, it’s easy to mistake higher spend for stronger loyalty. For a more comprehensive understanding, retailers should measure loyalty metrics like retailer share of wallet, closure rate, and share of trips—not just sales or loyalty program enrollment.
Loyalty Program Influence on Consumer Behavior
There’s no question that loyalty programs matter. According to a Numerator Verified Voices Survey of over 500 shoppers who recently made a purchase online or in-store at a consumer goods retailer or restaurant, 54% say loyalty programs have a strong or very strong influence on where they choose to shop, while another 36% say they have at least some influence.
But shoppers are more than willing to enroll in multiple loyalty programs. More than three-quarters of shoppers belong to at least three free loyalty programs. Nearly 46% belong to three to five free programs, while another 31% belong to six or more.
Today’s shoppers are joining a range of loyalty programs and deciding where to shop transaction by transaction.
Earning Loyalty Program Participation
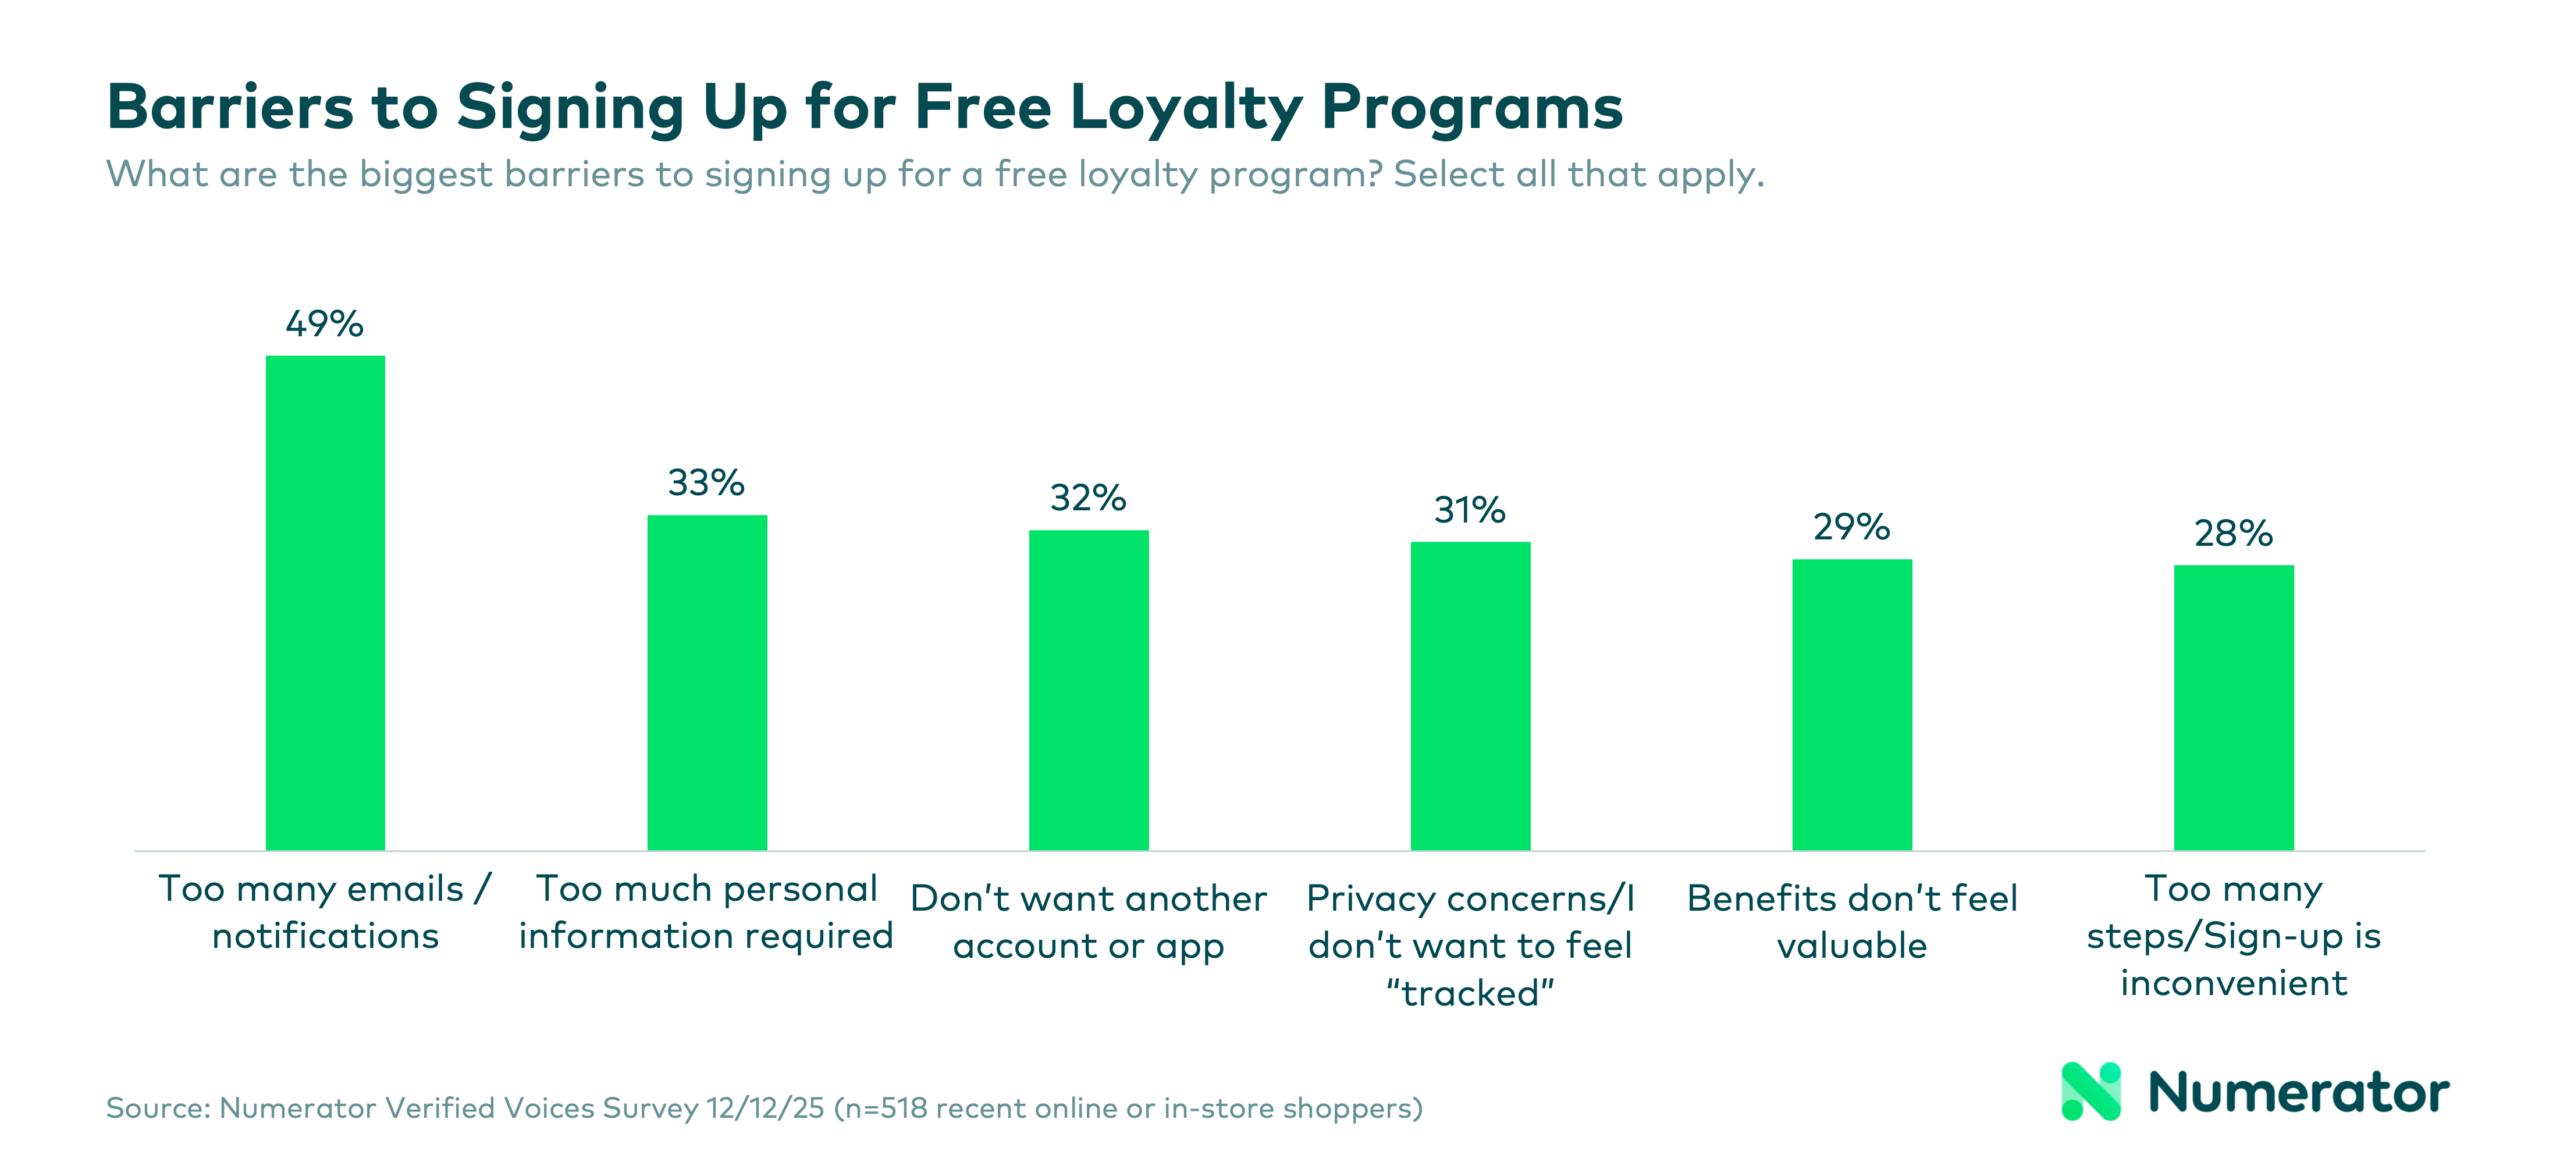
Even free loyalty programs have barriers to adoption: nearly half of shoppers (49%) say they avoid signing up because they don’t want more emails or notifications. Another 33% say programs require too much personal information, while 32% simply don’t want another account or app to manage.
Reducing friction matters just as much as offering the right benefits. A loyalty program can’t influence shopping behavior if shoppers never enroll in the first place.
Attracting Paid Loyalty Program Participants
Cost isn’t necessarily the obstacle retailers may assume it is. Nearly 80% of shoppers belong to at least one paid loyalty program. More than half belong to one or two paid memberships, while 21% participate in three or more.
Shoppers are willing to pay for value: the top reason shoppers join paid memberships is free or faster shipping (52%), followed by everyday savings that outweigh the membership fee (41%) and better discounts or rewards (41%). Convenience, streaming benefits and exclusive experiences all matter, but tangible financial value remains the strongest motivator.
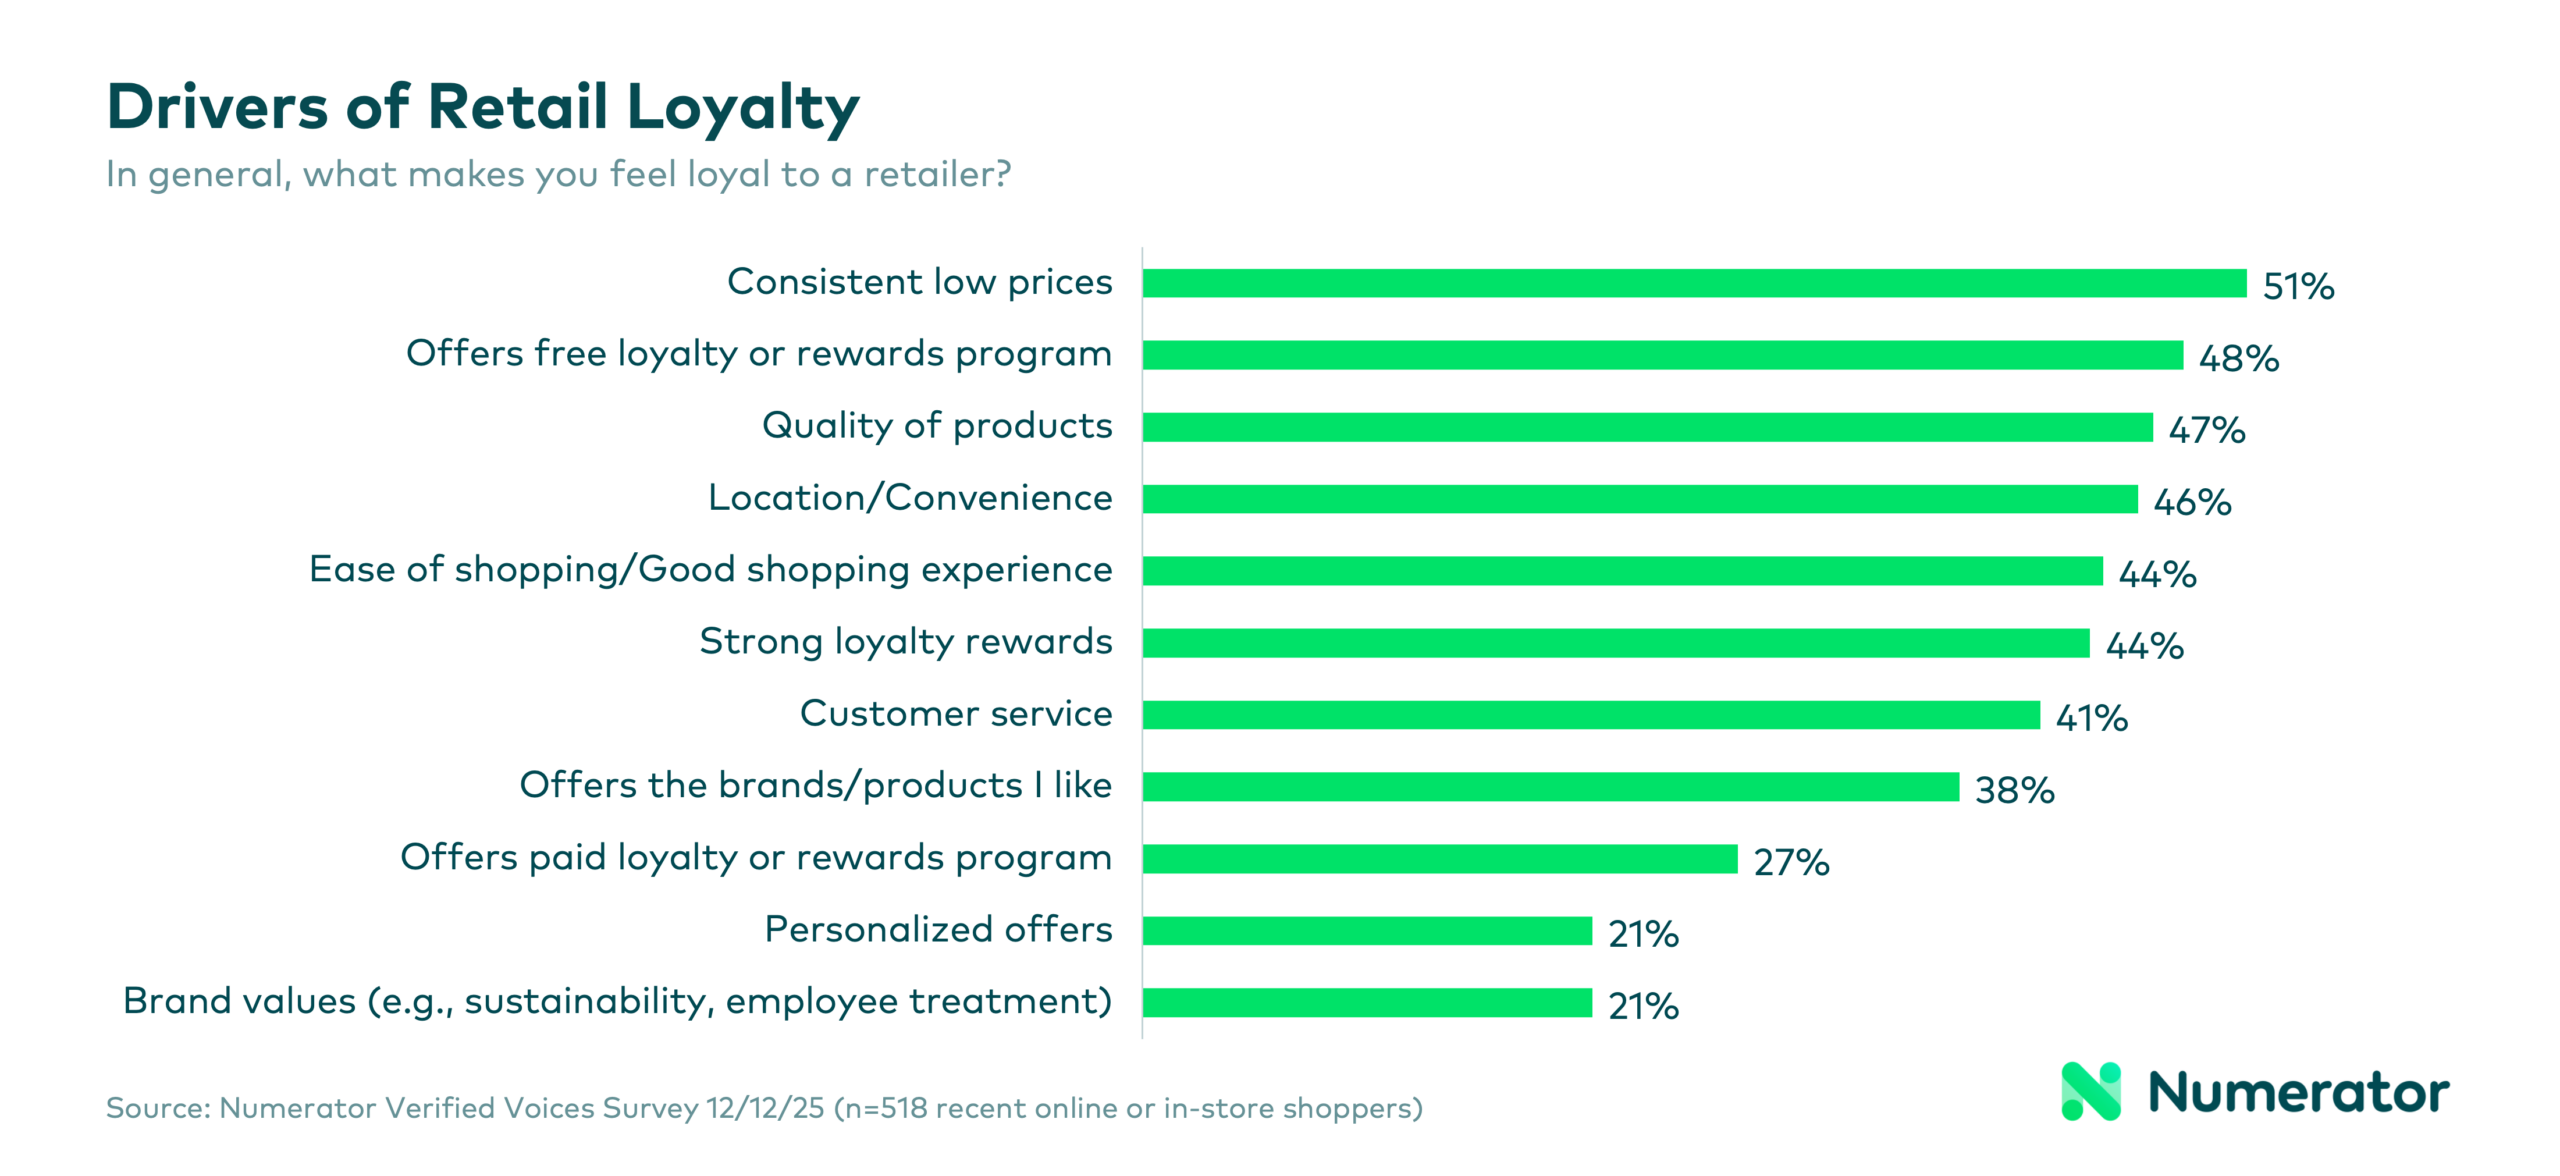
Even then, loyalty programs are only one factor in retailer choice. When asked what drives how loyal they feel to a retailer, 51% of shoppers pointed to consistent low prices, 47% cited product quality, 46% location and convenience, and 44% ease of shopping. By comparison, 48% identified free loyalty programs as an important factor and only 27% rated paid programs as important.
For retailers, loyalty programs will work best when they reinforce an already strong value proposition.
Deeper Engagement Among Paid Loyalty Program Members
While survey data explains why shoppers join loyalty programs and how those programs can influence behavior, their verified purchase behavior shows what happens after they do.
Across Amazon Prime, Walmart+, Target Circle 360 and Kroger Boost, paid members dedicate substantially more of their total retail spending to the retailer than non-members. Amazon Prime members allocate 10.3% of their total retail spending to Amazon, compared with 5.6% among non-members—a 84% increase. Walmart+ members devote 18.2% of their spending to Walmart versus 9.0% for non-members, while Kroger Boost members dedicate 14.2% of their spending to Kroger compared with 5.6% for non-members—a 153% lift.
The difference isn’t just larger baskets: Amazon Prime members make on average 102 shopping trips at Amazon per year, compared with 49 among non-members. Walmart+ members shop at Walmart 122 times annually versus 62 for non-members. Kroger Boost members make 106 trips compared with 46 among non-members.
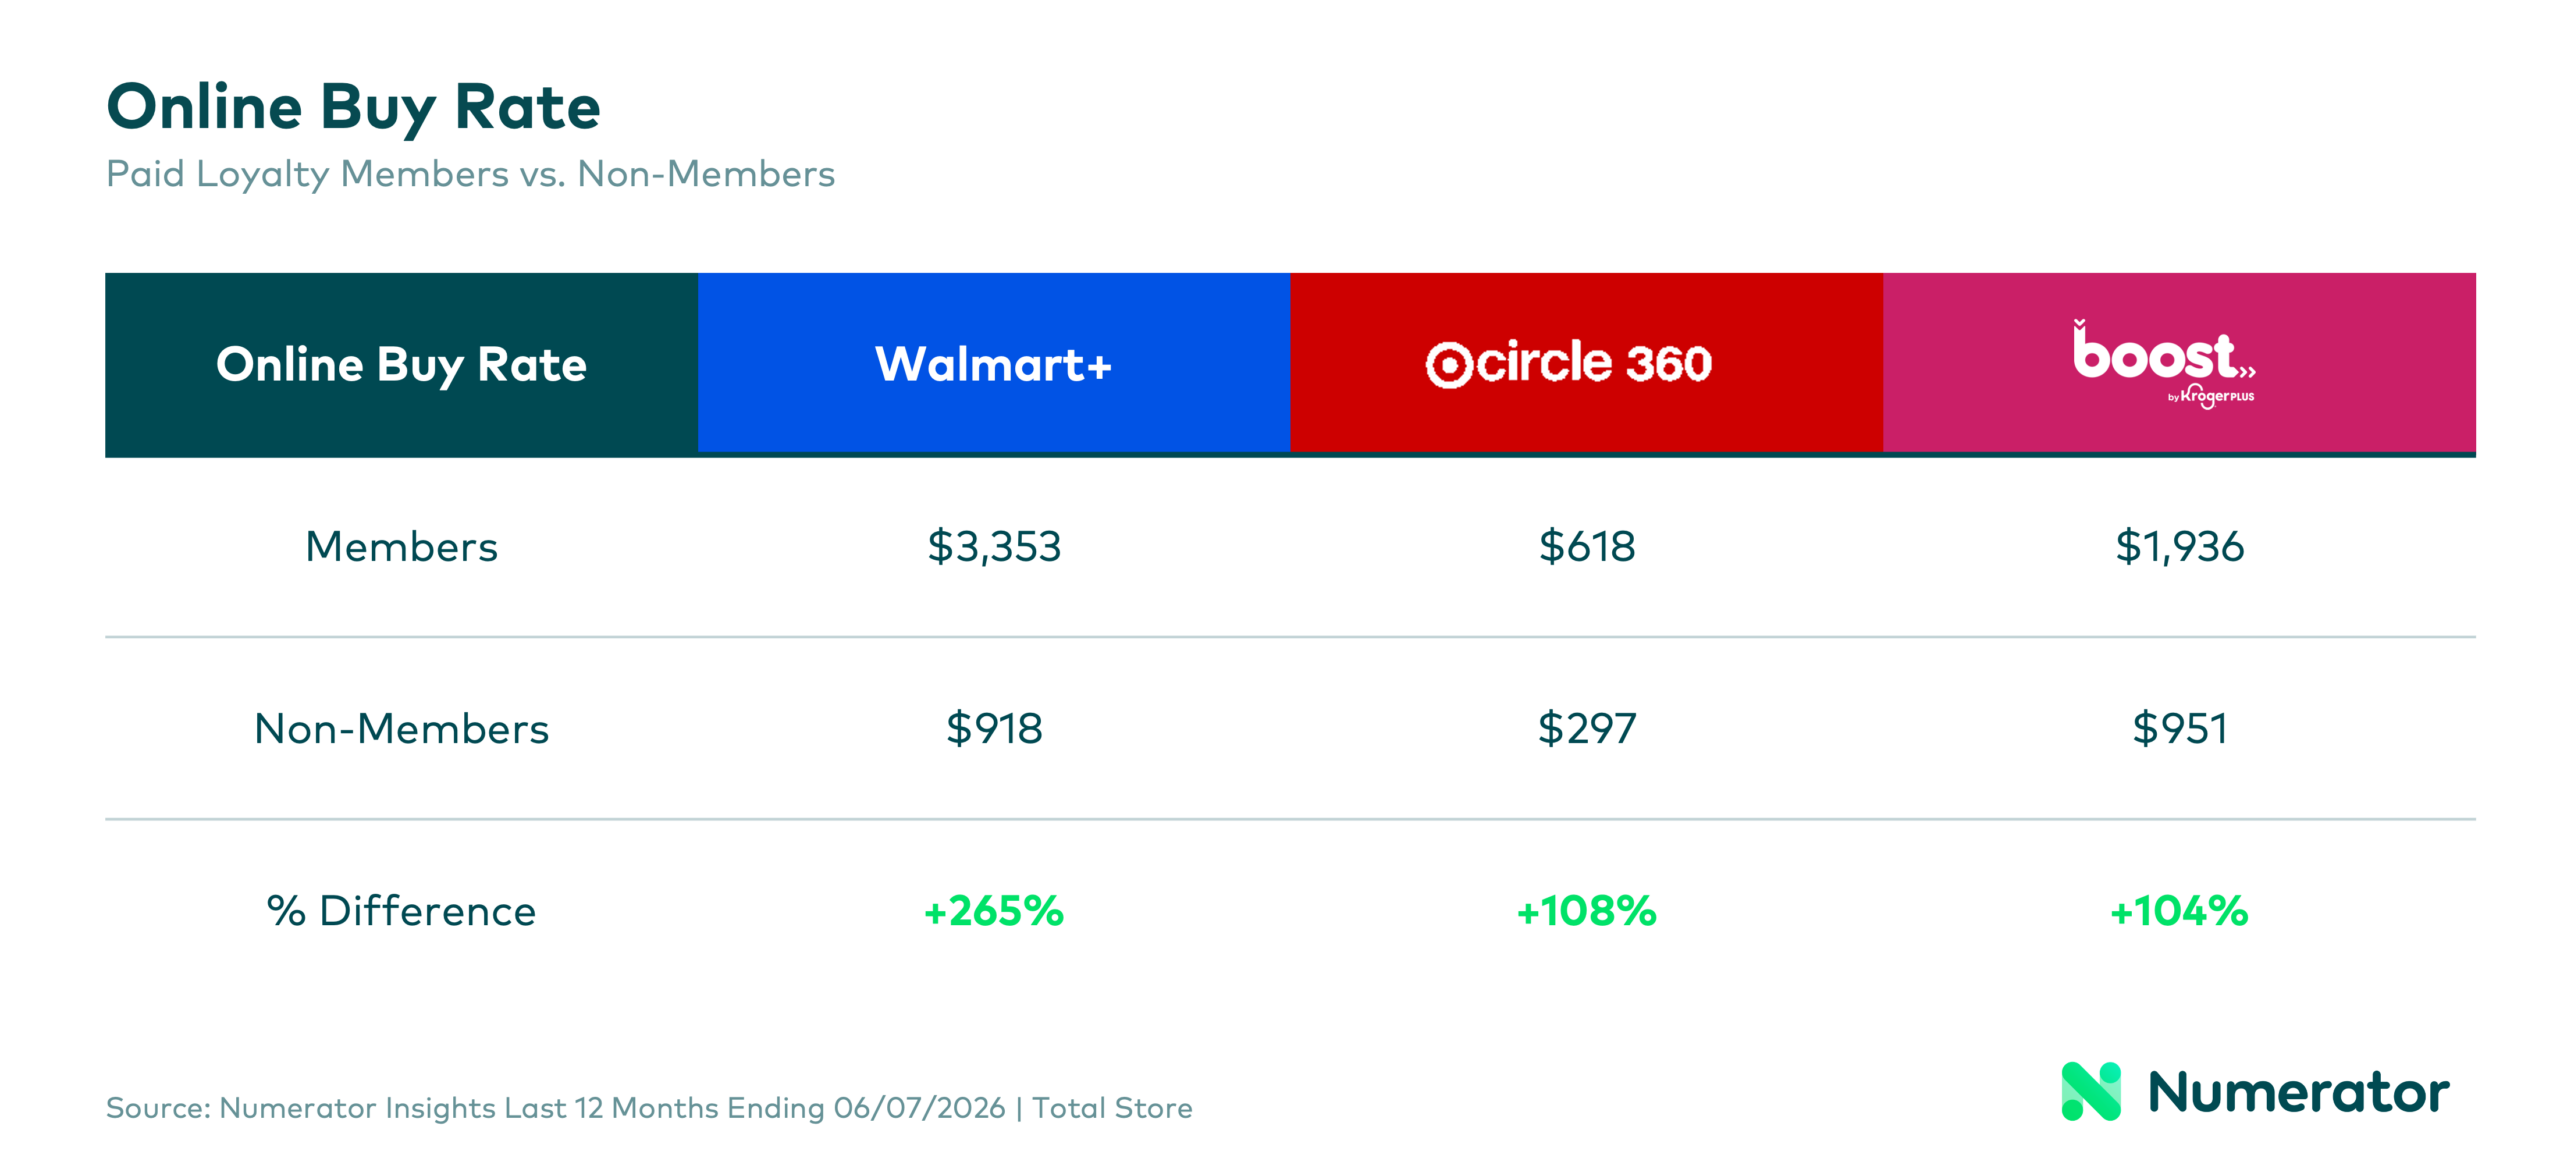
Paid memberships also strengthen digital engagement. Depending on the retailer, members generate between 104% and 265% more online spending per household than non-members.
Tiered loyalty or membership programs show an even stronger pattern: Costco Executive members devote 20.4% of their total retail spending to Costco, compared with 11.1% among Gold Star members. They spend $4,629 annually, versus $2,252 for standard members, and shop at Costco 36 times per year compared with 21 trips made by standard members.
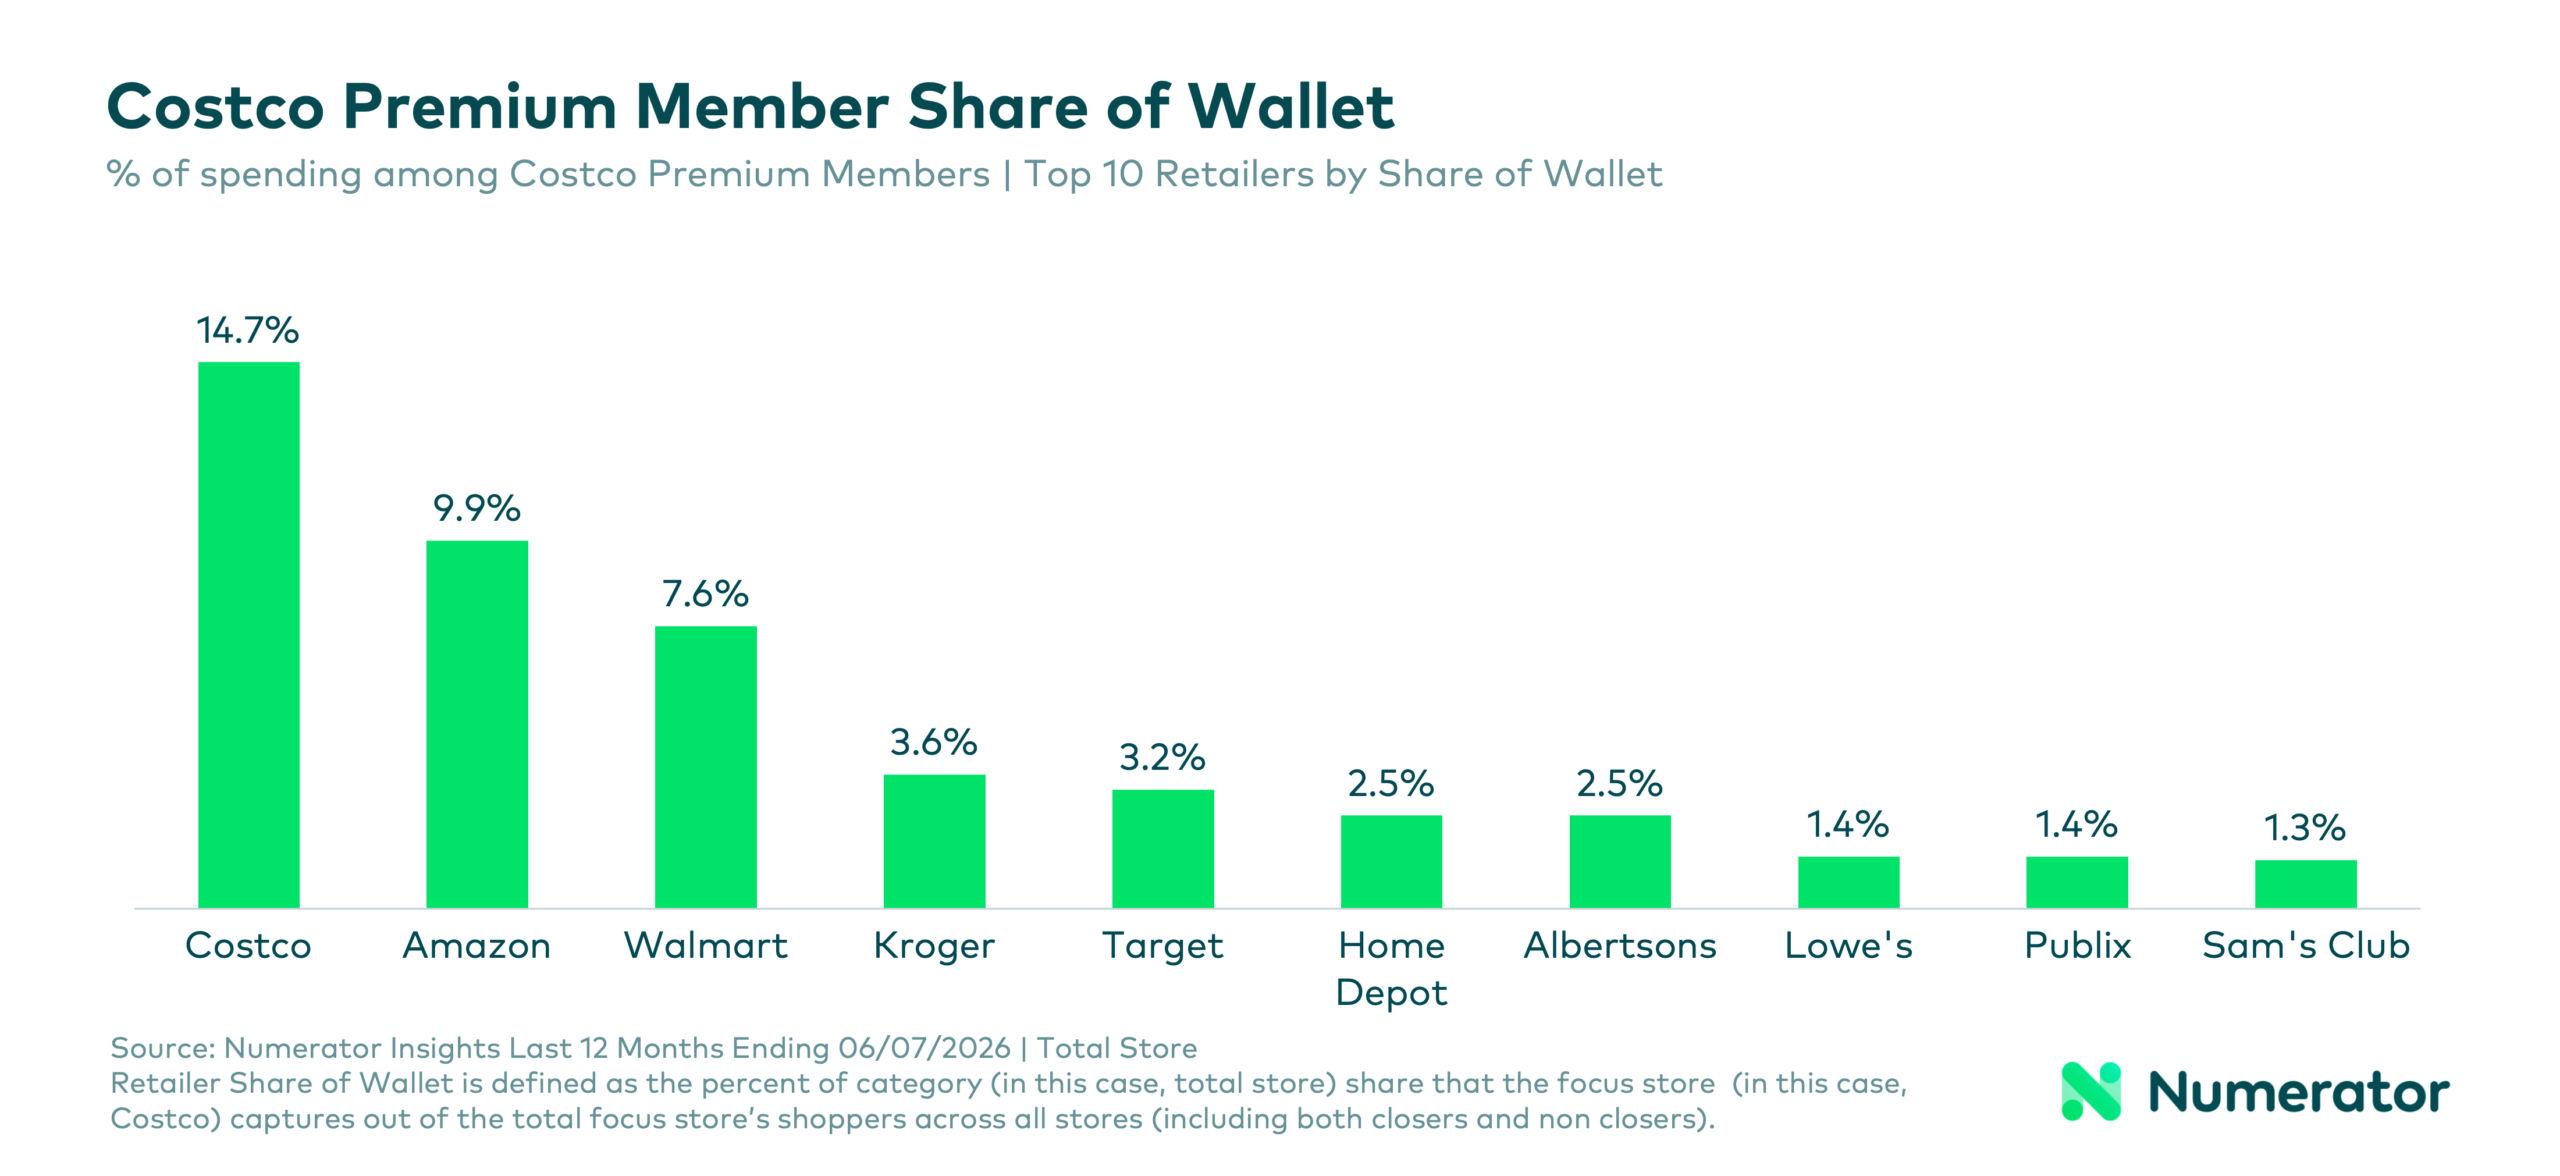
Yet even Costco’s most valuable members spend only about 15% of their total retail dollars at Costco. Amazon captures another 9.9% and Walmart 7.6%, with meaningful spending spread across Kroger, Target, Albertsons, Home Depot, and other retailers. Even a retailer’s best customers aren’t exclusively spending the majority of their dollars at one store.
Moving Forward with Loyalty Measurement
Measuring loyalty requires looking beyond a retailer’s own four walls. Internal performance and loyalty program data can only tell retailers what’s happening inside their business. Omnichannel consumer purchase data explains the why behind a retailer’s performance—and can help identify future growth opportunities based on leakage, lapsing, and feedback from those supposedly loyal shoppers who also spend a significant portion of their dollars with competitors.
Looking to better understand just how loyal your shoppers really are and how you can grow your share of their wallet? Numerator can help. Reach out to your Numerator account team or get in touch with us today.
*Additional analysis for this piece was provided by Matt Harris (Consultant, Numerator) and Megan Muetterties (Marketing Researcher, Numerator).
