A deep understanding of your consumer, as every good insights professional knows, is critical not only in serving their needs, but also in targeting and advertising effectively. In the realm of food delivery services, everything seems to be happening at lightning speed… aside from that sushi order you placed an hour ago. (Shouldn’t it be here by now?) In such a fast-paced industry, brands need fast-paced insights to better understand consumers’ wants and needs, and here at Numerator, we have just what you ordered.
Gone are the days of having to venture into the world to get food from your favorite restaurants. The growth of app-based food delivery services like DoorDash, GrubHub, Postmates, and UberEats has resulted in an unprecedented shift in the food service industry, giving consumers new ways to enjoy their favorite foods, and giving food providers far more to consider as they try to keep a competitive edge.
At a high level, Numerator data shows that the average food delivery service user places about 7.2 orders annually, spending roughly $22 per order. Who are the individuals behind the orders, and what do we know about their preferences when it comes to dining? What advertising strategies are key players in this space using to attract customers, and do they seem to be hitting their target markets? We dug into our data to get a better understanding of this exciting industry.
Demographic Details
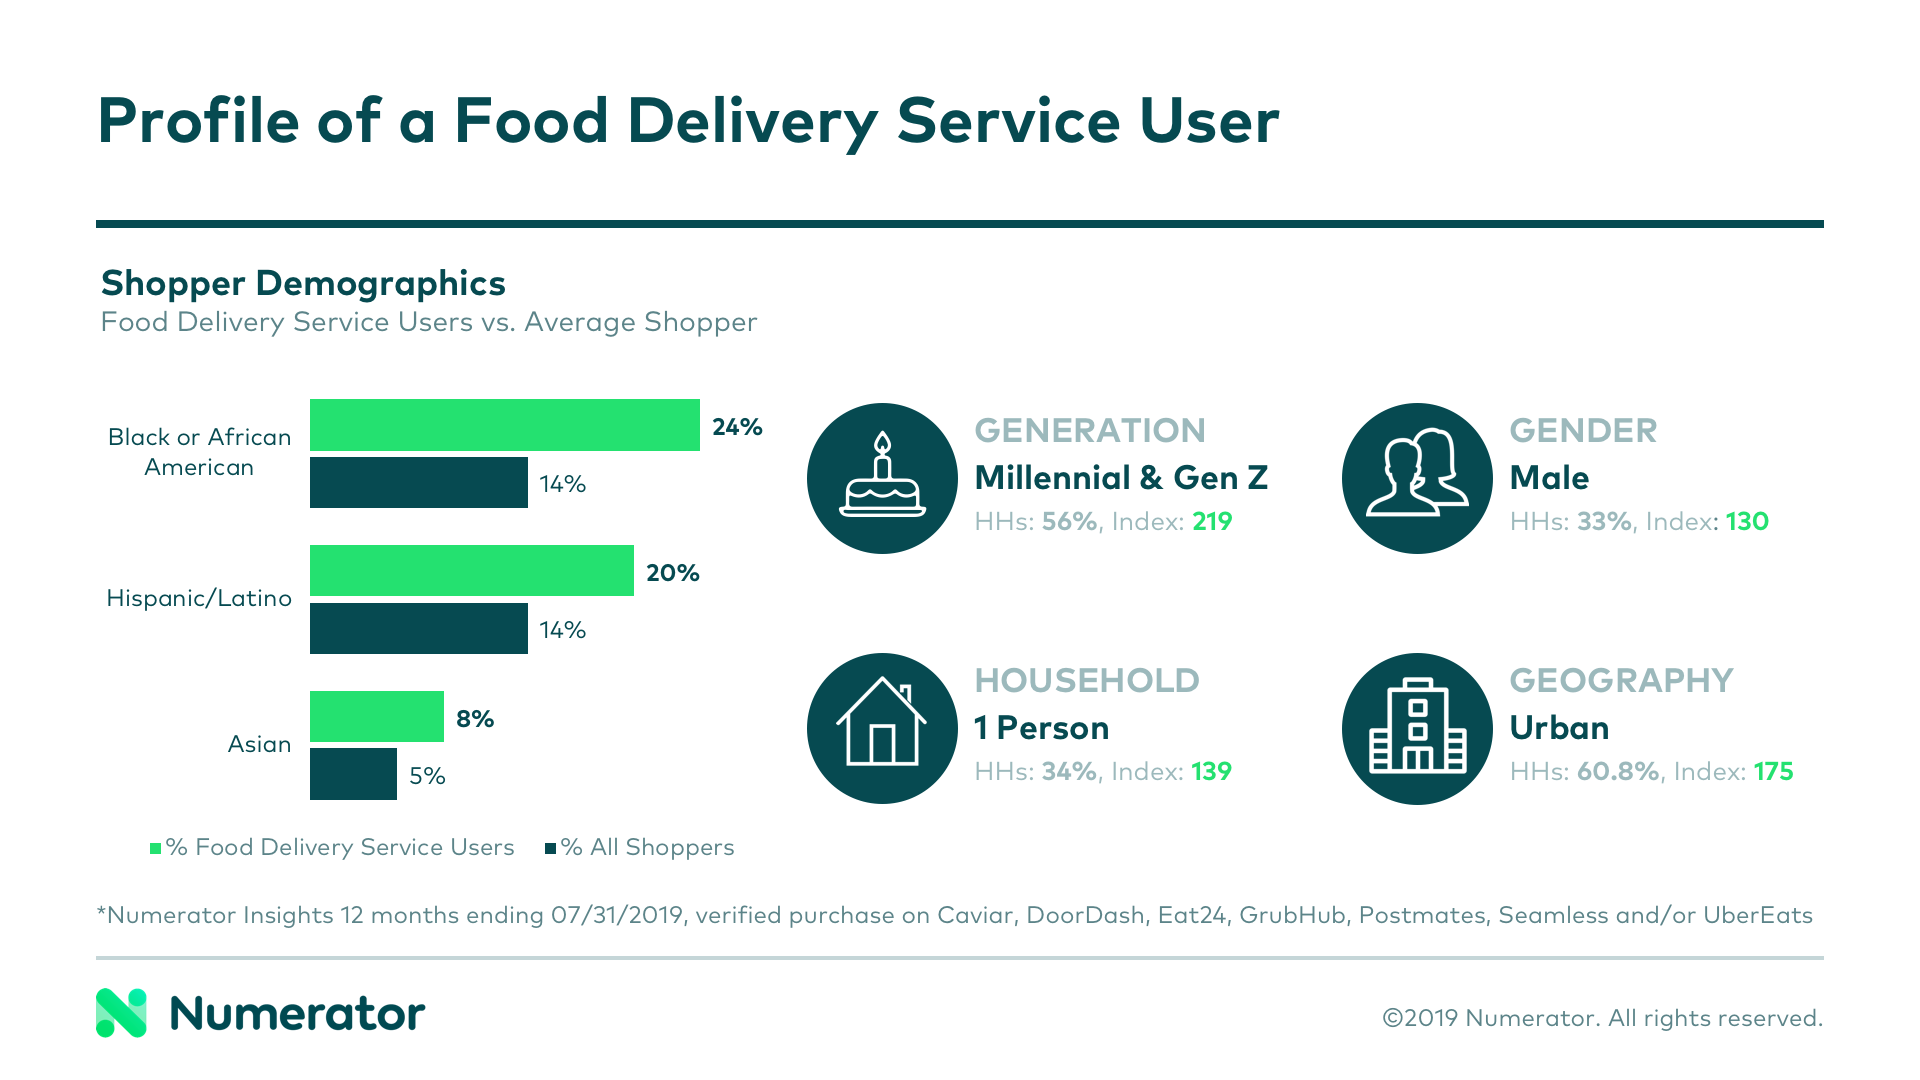
According to shopper insights data from our OmniPanel, more than half (56%) of food delivery service users are Millennials or Gen Z’ers. They’re more likely to be male (index 130), to live in an urban setting (index 175), and to be the only person in their household (index 139). Users also tend to be more diverse than the general population, over-indexing with all minority races and ethnicities, and under-indexing with white/caucasian individuals.

Delivery services appear to be most popular with individuals in the Pacific region, with 21% of users coming from this region (index 144). This feels fitting, given most key players in this space began their delivery endeavors in the San Francisco or LA areas. The West Coast may be 1-3 hours behind the rest of the country, but they’re ahead when it comes to delivery.
Psychographic Insights
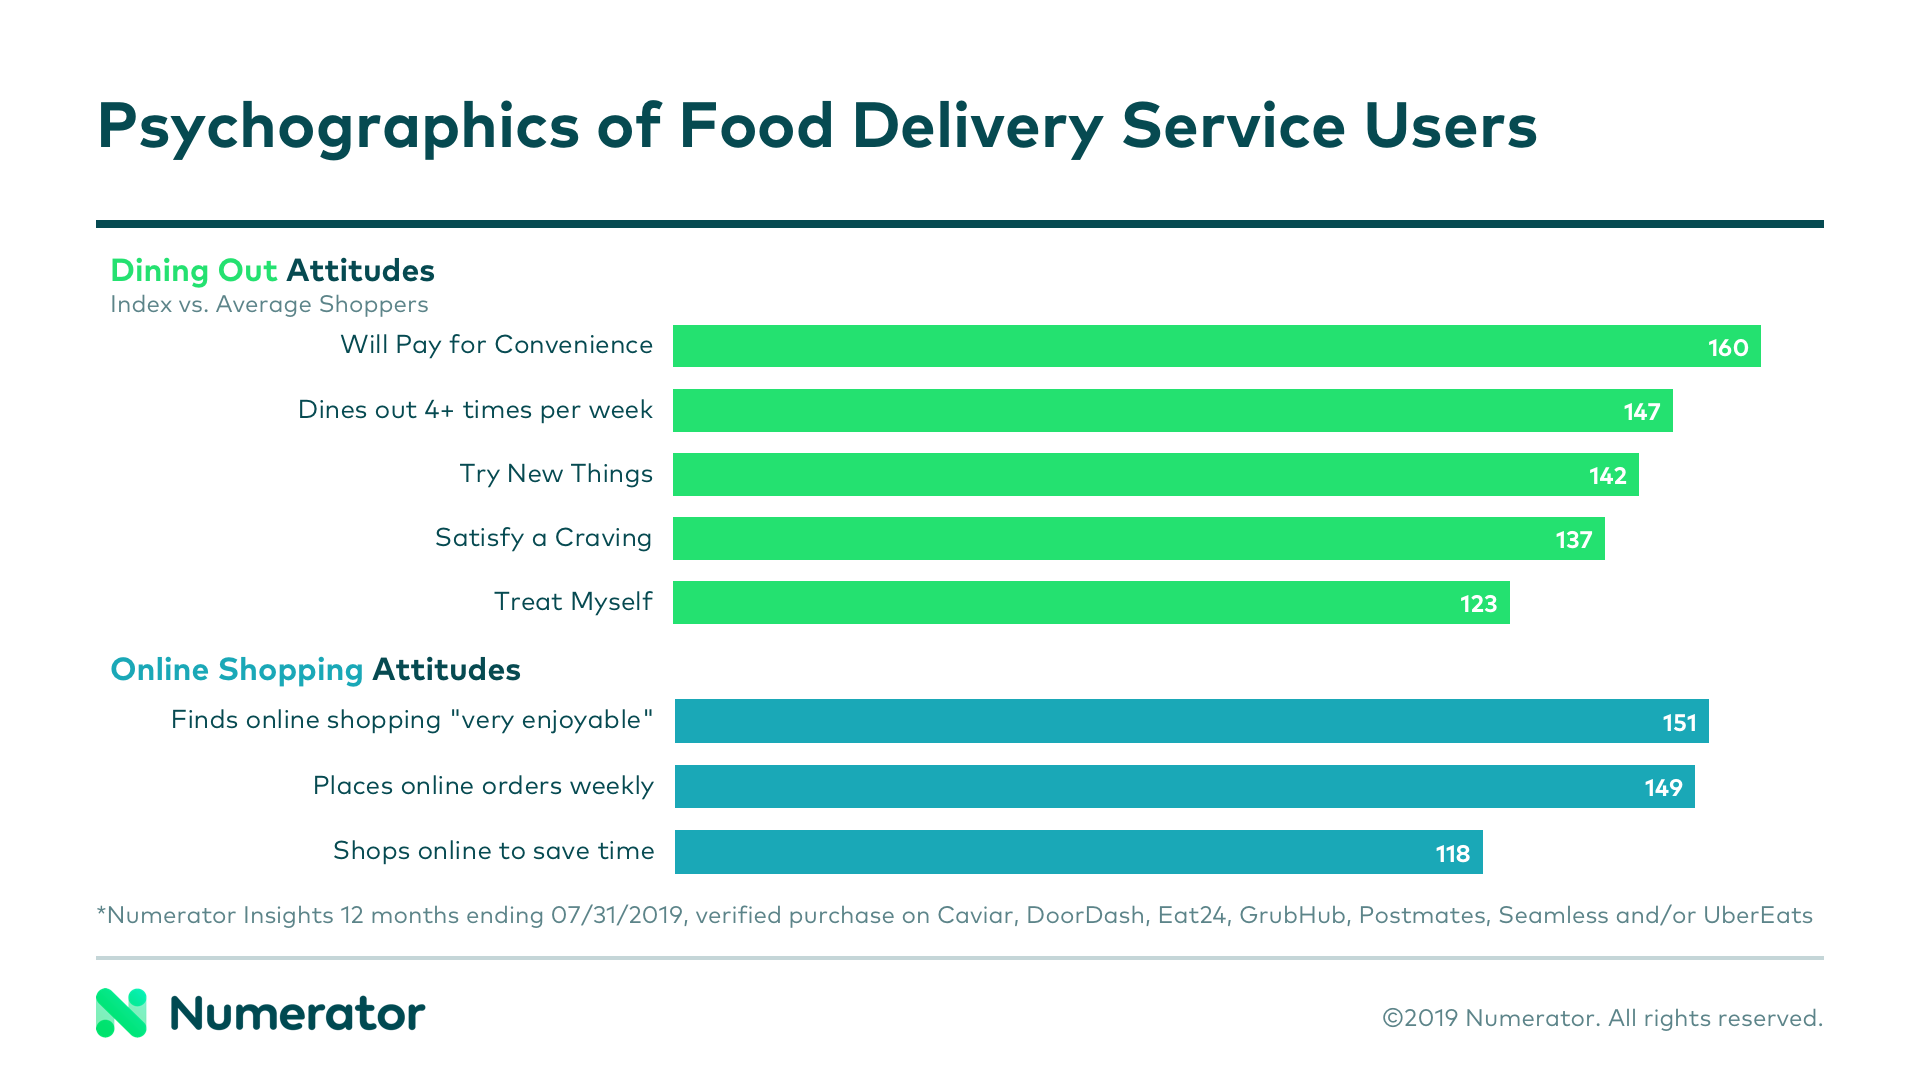
Food delivery service users love going out to eat. Nearly 20% dine out 4+ times per week, and their primary reasons for doing so revolve around satisfying a craving (47%), treating themselves (33%), and trying new things (30%). In terms of the food itself, ordering in offers many of the same benefits as dining out, so it’s likely that many of the primary drivers for dining out are applicable for ordering in. This group is 1.6x more likely to say they will pay for convenience when dining out, and what’s more convenient than getting the food you want without ever leaving your couch?
Coupling dining preferences with online shopping preferences tells us even more about why these shoppers may opt in for delivery services. They’re more likely to consider online shopping “extremely enjoyable,” and 25% of them place online orders on at least a weekly basis. It seems only natural that a group with an affinity for “traditional” online shopping would enjoy ordering their food that way, as well. They also consider time savings a significant benefit of shopping online, which goes hand-in-hand with their willingness to pay for convenience.

Advertising Strategies
Using Numerator Ad Intel Data, we took a look at the advertising strategies for top players: DoorDash, GrubHub, Postmates and UberEats. By far and away, GrubHub boasted the highest ad spend, investing roughly $71 million over the past 12 months. Spending for other competitors was significantly lower, but still nothing to sneeze at; DoorDash came in at $44 million, Postmates $31 million, and UberEats with the lowest spend of $28 million.
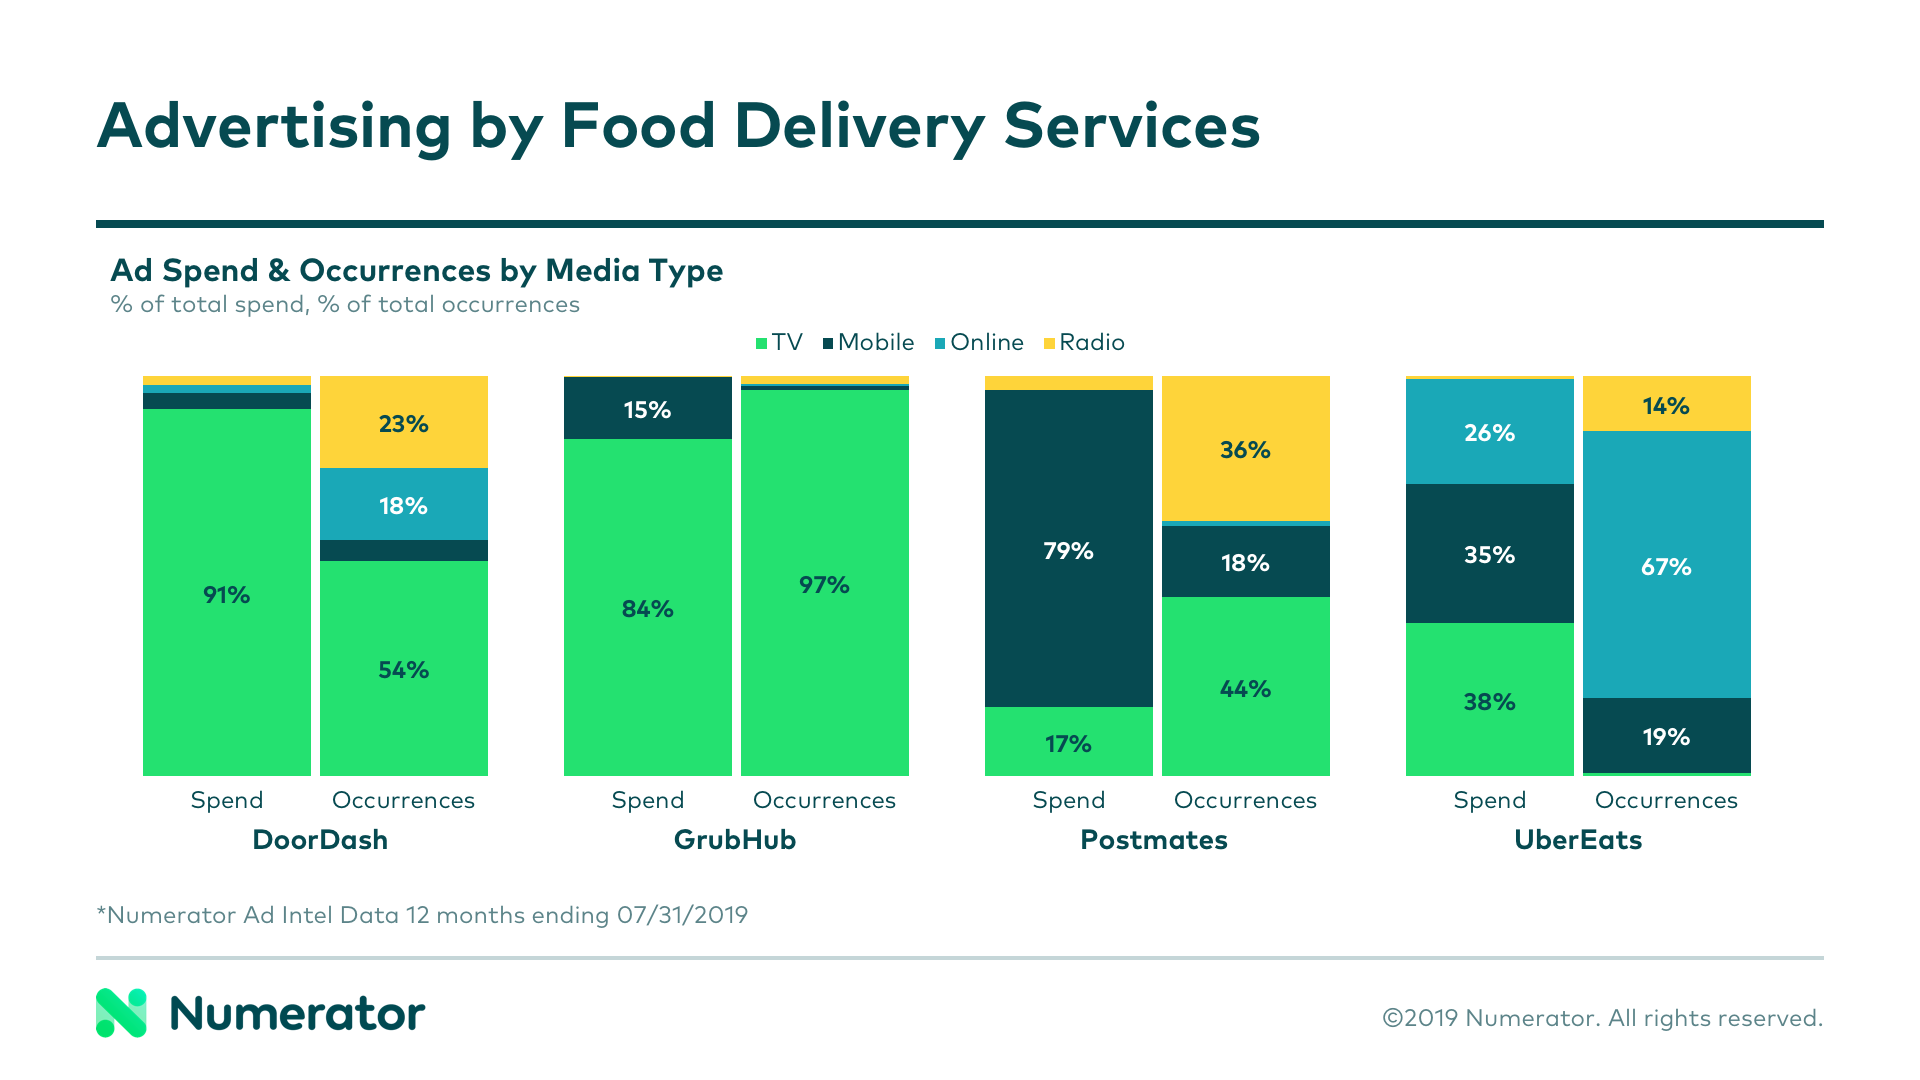
Breaking down this spending, we see that DoorDash and GrubHub both opted to invest the majority of their ad dollars in television. Postmates doubled down on mobile, while UberEats spread their dollars fairly equally across online, mobile, and television.
Obviously, not all ads are priced equally, even within the same media type. For example, DoorDash spent 91% of their ad dollars on TV, but also invested in lower cost, more frequent radio and online ads. The same is true of Postmates with mobile ads; though they spent 79% of their ad dollars on mobile, only 18% of Postmates ad occurrences were attributed to that media type.

Numerator psychographic data shows that users of food delivery services consider online, social media, and mobile advertisements the most influential forms of advertising. They also rank television ads as highly influential, but less so than the general population. This does beg the question, though: is the heavy spending on television ads worth it for a group that prefers mobile and online, especially when the service itself is exclusively available online and via mobile apps?
UberEats x March Madness
One particularly interesting insight that emerged from our advertising analysis came from UberEats and their television strategy. Though they spent 38% of ad dollars on TV, only about 1% of their overall ad occurrences came from their TV ads. Furthermore, their average spend per commercial was nearly 16 times higher than any of the other services analyzed. So, what was their strategy?
A closer look revealed that their television ad budget was almost entirely dedicated to commercials that aired throughout the 2019 NCAA Tournament, including multiple million-dollar commercials airing during the Final Four matchups.
According to Numerator Psychographics data, UberEats users are slightly more likely to be fans of college basketball than users of other delivery services; they’re also more likely to consider television the most influential form of advertising. Curious coincidence, or did Uber hit the nail on the head? Despite the general caution against expensive television ads for an online-and-mobile-centric group, it’s clearly still possible to identify niche groups who may not fit the mold.
Who do you want to target, and how can you tailor your messaging and media mix to resonate with them most successfully? Place your order with our team today, and let us deliver you actionable insights to help drive your business.

